-
-
Notifications
You must be signed in to change notification settings - Fork 3
New issue
Have a question about this project? Sign up for a free GitHub account to open an issue and contact its maintainers and the community.
By clicking “Sign up for GitHub”, you agree to our terms of service and privacy statement. We’ll occasionally send you account related emails.
Already on GitHub? Sign in to your account
Visualization of relations between one OHS and multiple consumers #13
Comments
|
Hi @dwu Thanks for reporting the issue! I'm aware of this limitation... There are two things we would have to change in order to improve the visualization:
Side note: The example on the examples page that shows it as you would have expected it, was created manually ;) If you want to help us improving the Context Map generator, contributions are always welcome ;) Best regards, |
|
Hi @stefan-ka, Thanks for the quick and detailed response. Regarding your second point: as far as I know, you're right. Graphviz does not allow defining the points where edges connect to nodes explicitly apart from specifying a After some quick experiments with graphviz to get an idea how this could look like it seems that displaying OHSs as nodes in a way that is as compact and clear as the current representation will be quite tricky. At least if I'm not missing anything in the graphviz documentation. Here's a naive example with two OHSs Example source codeIn my opinion it is not really obvious that Grouping related nodes as an alternative to moving them closer together does not look too promising either as support for grouping nodes seems to be rather limited. The only way I could find in the documentation is grouping by introducing clusters (subgraphs with a name prefix of Example source codeIn my opinion this however does not fit the current notation style and as far as I could see, there's no way to influence how groups are displayed apart from setting the style attribute on the cluster subgraph ( All in all it unfortunately looks like the implementation options for the context map using graphviz are rather limited. :/ Kind regards |


When modeling three contexts
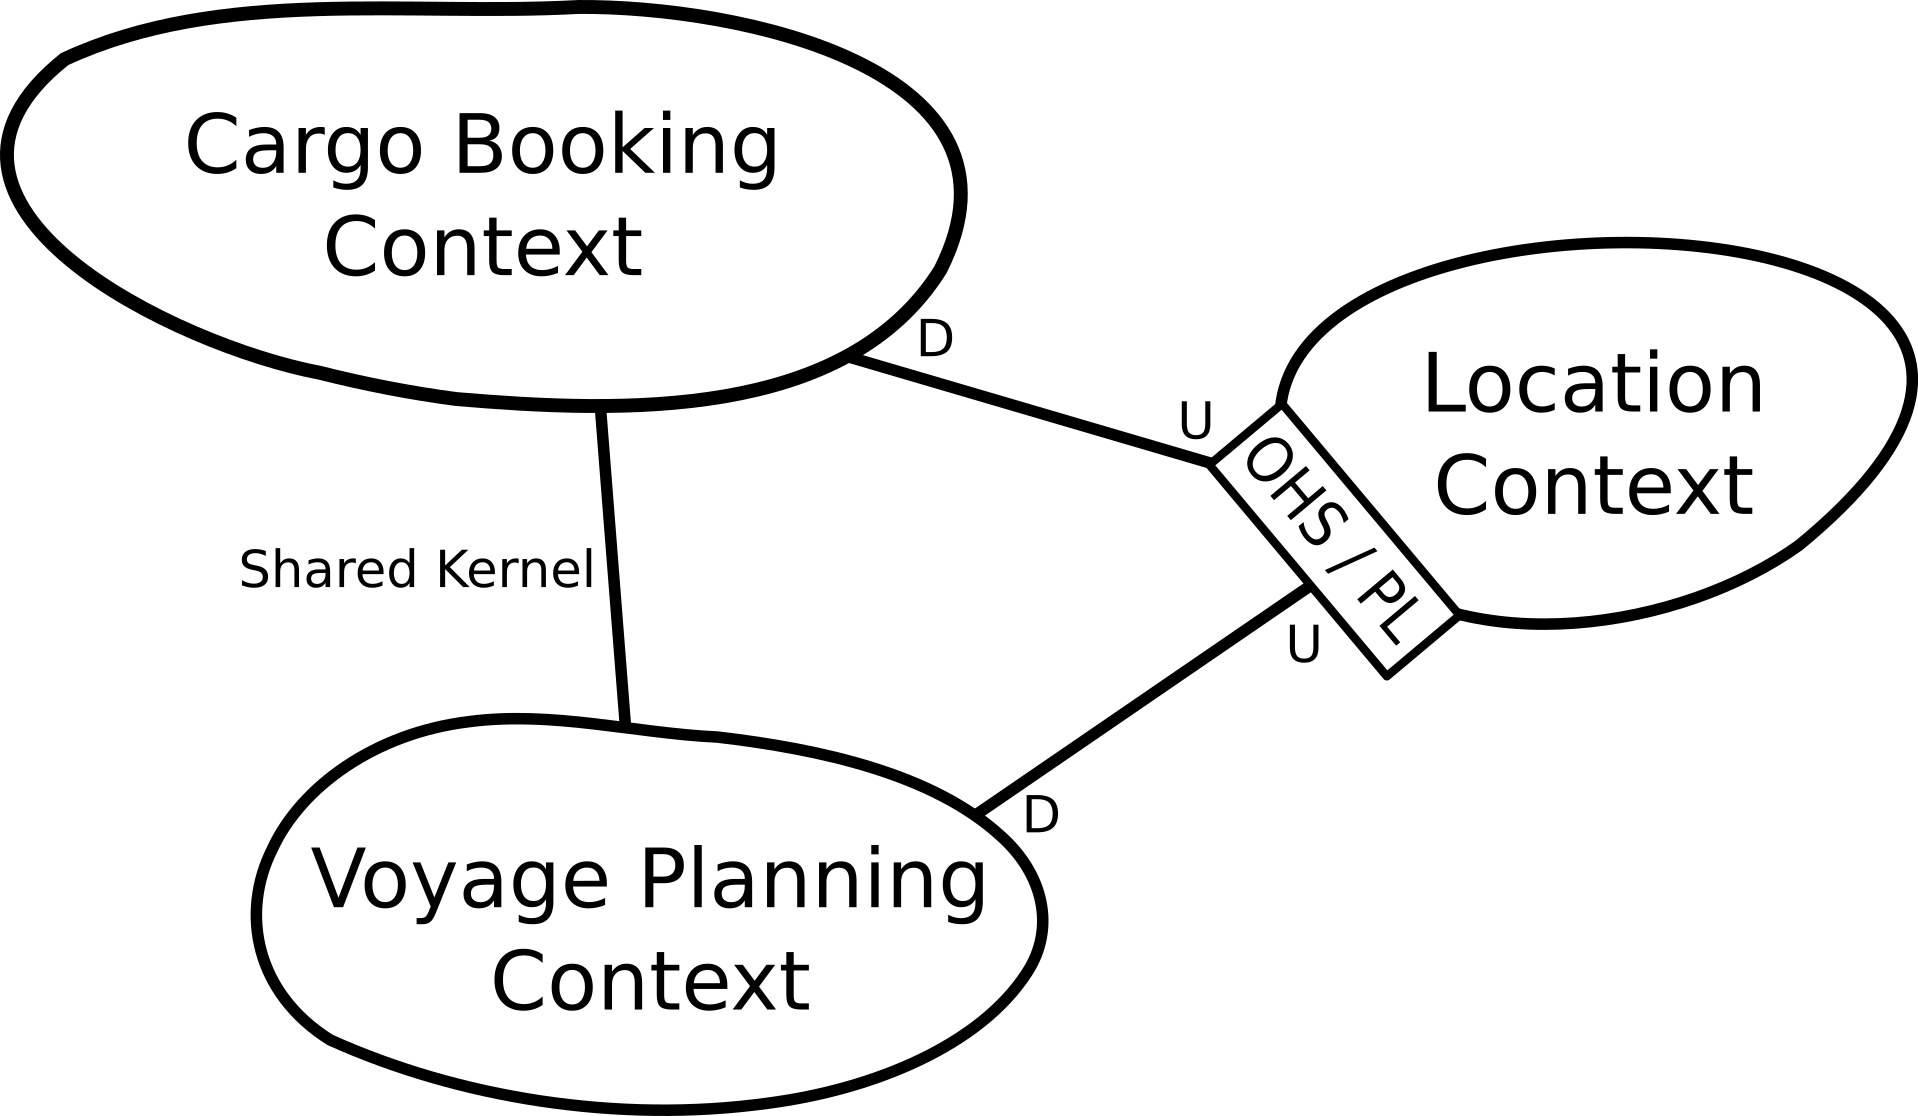
ContextA,ContextB,ContextCwithContextAproviding an OHSServiceAto bothContextBandContextCwhere the relationshipsContextA -> ContextBandContextA -> ContextChave the samenameI would have expected a context map diagram with one OHS onContextAwith edges to bothContextBandContextCto make it obvious that both consumers consume the same OHS.Instead, the context map diagram shows
ContextAwith two OHSs, one for each relation.I'm not sure whether this is intended behavior and just a misunderstanting of the visual notation on my side or a bug / due to limitations of how graphviz renders edges between nodes when no port is specified.
Here's an example:
Expected result:

Actual result:

A similar behavior can be observed when exporting to PlantUML where two interfaces for
ServiceAare generated with one of them being referenced byContextBand one byContextC.Expected result:

Actual result:

Interestingly, the DDD sample linked from the examples page shows the visualization I would have expected.
Context map in the documentation:

Context map when generated from the stage 5 source of the sample using the contextmapper vscode plugin version v6.5.1 (operation "Generate Graphical Context Map"):

The text was updated successfully, but these errors were encountered: