Skip to content
New issue

Have a question about this project? Sign up for a free GitHub account to open an issue and contact its maintainers and the community.

By clicking “Sign up for GitHub”, you agree to our terms of service and privacy statement. We’ll occasionally send you account related emails.

Already on GitHub? Sign in to your account

save desplot resulting from plot() into object #40

Closed
SchmidtPaul opened this issue Nov 9, 2023 · 4 comments
Closed

save desplot resulting from plot() into object #40

SchmidtPaul opened this issue Nov 9, 2023 · 4 comments

Comments

@SchmidtPaul
Copy link

SchmidtPaul commented Nov 9, 2023

Hey, I want to make use of your plot() function (instead of manually creating my own desplots) for teaching purposes (see here) , but I would like to use other colors/layout. I thought I could simply create the resulting plot into an object and alter it afterwards, but the function isnt acutally returning the plot, right? It's just showing it:

library(FielDHub)

x <- CRD(
  t = letters[1:3],
  reps = 3,
  seed = 42
)

y <- plot(x)

str(y)
#> List of 1
#>  $ field_book:'data.frame':  9 obs. of  7 variables:
#>   ..$ ID       : int [1:9] 1 2 3 4 5 6 7 8 9
#>   ..$ LOCATION : num [1:9] 1 1 1 1 1 1 1 1 1
#>   ..$ PLOT     : int [1:9] 101 102 103 104 105 106 107 108 109
#>   ..$ ROW      : int [1:9] 1 1 1 2 2 2 3 3 3
#>   ..$ COLUMN   : int [1:9] 1 2 3 3 2 1 1 2 3
#>   ..$ REP      : Factor w/ 3 levels "1","2","3": 1 2 2 3 2 3 1 1 3
#>   ..$ TREATMENT: chr [1:9] "a" "b" "b" "c" ...

I guess I would only want something like this instead. And as you may know, updating such a plot would be quite simple:

z <- desplot::desplot(
  data = y$field_book,
  form = TREATMENT ~ ROW + COLUMN,
  text = TREATMENT,
  col.regions = c("#00923f", "#bce2cc", "#e9ecef"),
  cex = 1,
  show.key = FALSE,
  main = NULL
)

z

update(z, col.regions = c("red", "blue", "green"))

Created on 2023-11-09 with reprex v2.0.2

@DidierMurilloF
Copy link
Owner

Hey, @SchmidtPaul, I think that will be such a nice feature. I am going to add that and deploy it to CRAN in the following weeks. Thank you.

@SchmidtPaul
Copy link
Author

Hey, just a little reminder that I am still very interested in this. But of course, I understand if you have other priorities.

@DidierMurilloF
Copy link
Owner

DidierMurilloF commented Mar 27, 2024

FielDHub now returns the plot using the method plot(). This plot object is a ggplot2 object, so we can modify it as any other ggplot2 figure.

library(FielDHub)
library(ggplot2)

The same example you shared,

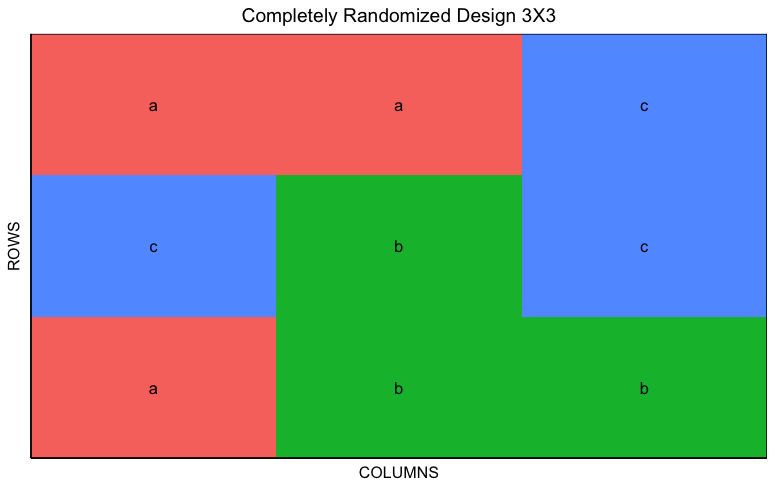
x <- CRD(
  t = letters[1:3],
  reps = 3,
  seed = 42
)

y <- plot(x)

p <- y$p
p

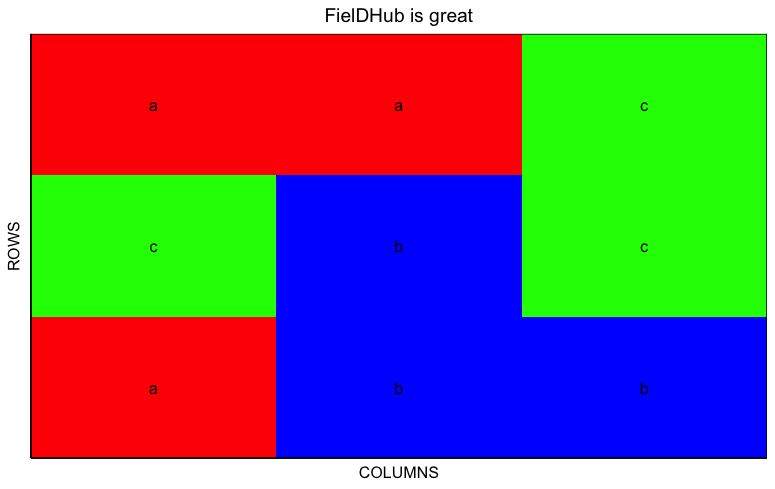
crd_layout <- y$p +
  ggtitle("FielDHub is great") +
  scale_fill_manual(values = c("red", "blue", "green"))

crd_layout

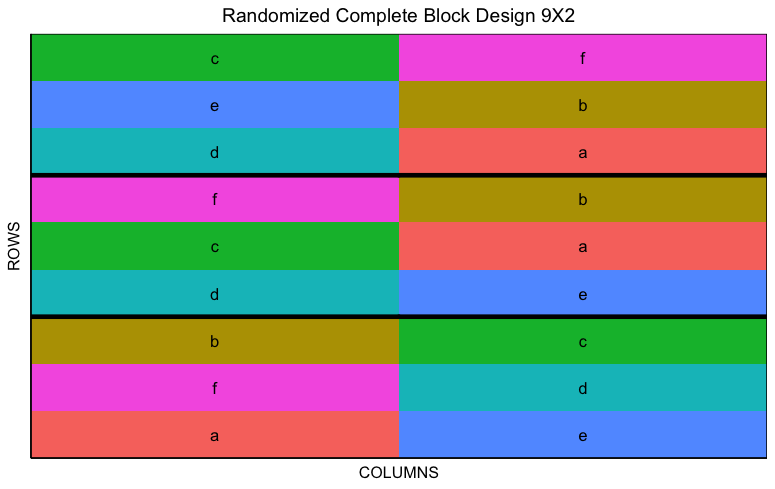
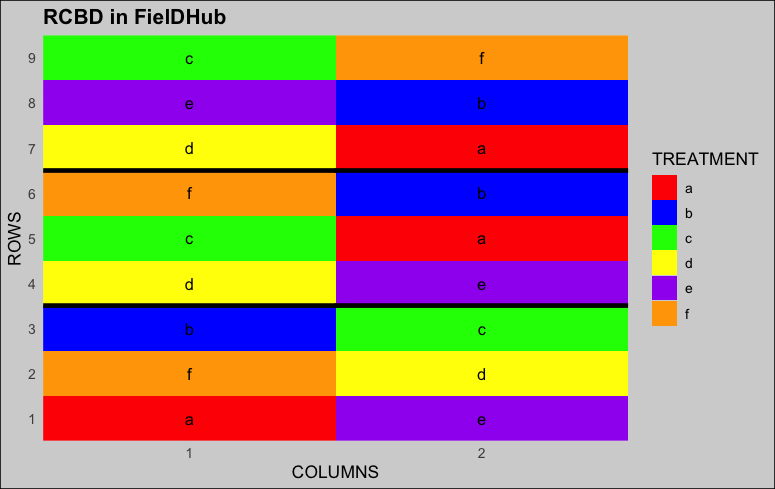
Let us try an RCBD,

v <- RCBD(
  t = letters[1:6],
  reps = 3,
  seed = 42
)

w <- plot(v)
p <- w$p
p

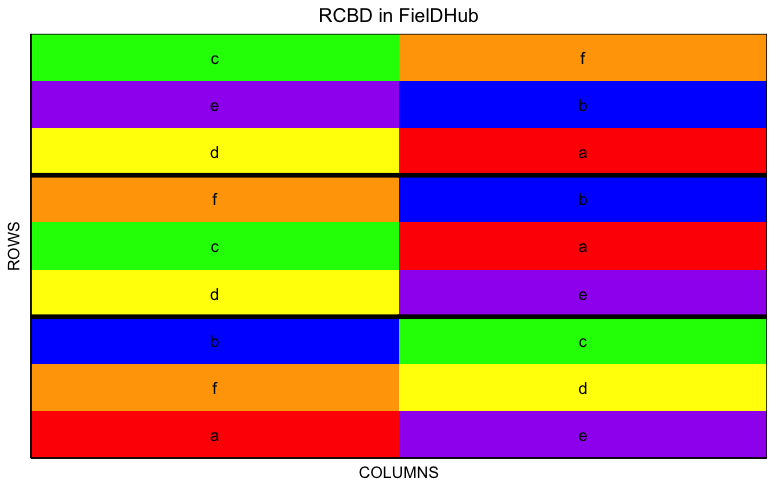
rcbd_layout <- w$p +
  ggtitle("RCBD in FielDHub") +
  scale_fill_manual(values = c("red", "blue", "green", "yellow", "purple", "orange"))

rcbd_layout

Let's add more features to the plot,

rcbd_layout <- rcbd_layout +
  scale_y_continuous(breaks = function(limits) seq(floor(limits[1]), ceiling(limits[2]), by = 1)) +
  scale_x_continuous(breaks = function(limits) seq(floor(limits[1]), ceiling(limits[2]), by = 1)) +
  theme_minimal() + 
  guides(color = "none") +
  theme(plot.background = element_rect(fill = "lightgray"),
        text = element_text(size = 12),
        plot.title = element_text(face = "bold"))
rcbd_layout

I think this way of modifying or customizing the plots is acceptable. What do you think? You can test this version using the GitHub version. I am planning to release a new version of the app to CRAN this weekend.

@SchmidtPaul
Copy link
Author

Fantastic! Thanks a lot! I immediately applied it to my website - check out the first few examples here.

I am closing this issue now because it has been solved.

One final note, though. I am assuming you switched from desplot::desplot() to desplot::ggdesplot(). While this should generally not be a problem and instead be advantageous since ggplot is better in several aspects, note that desplot::ggdesplot() is not as complete as desplot::desplot() as you can e.g. see in this or this issue. Again, it shouldn't actually cause any problems except in special situations but I am just pointing it out.
Finally, though, I have not tested it but suspect it would not be as easy to change the colors of the yellow and black lines generated by out1= and out2= right? At least I don't know how to change the static color of an existing layer.

Sign up for free to join this conversation on GitHub. Already have an account? Sign in to comment
Labels
None yet
Projects
None yet
Development

No branches or pull requests

2 participants