Name
Alpha趋势跟踪止损策略Alpha-Trend-Strategy-with-Trailing-Stop-Loss
Author
ChaoZhang
Strategy Description
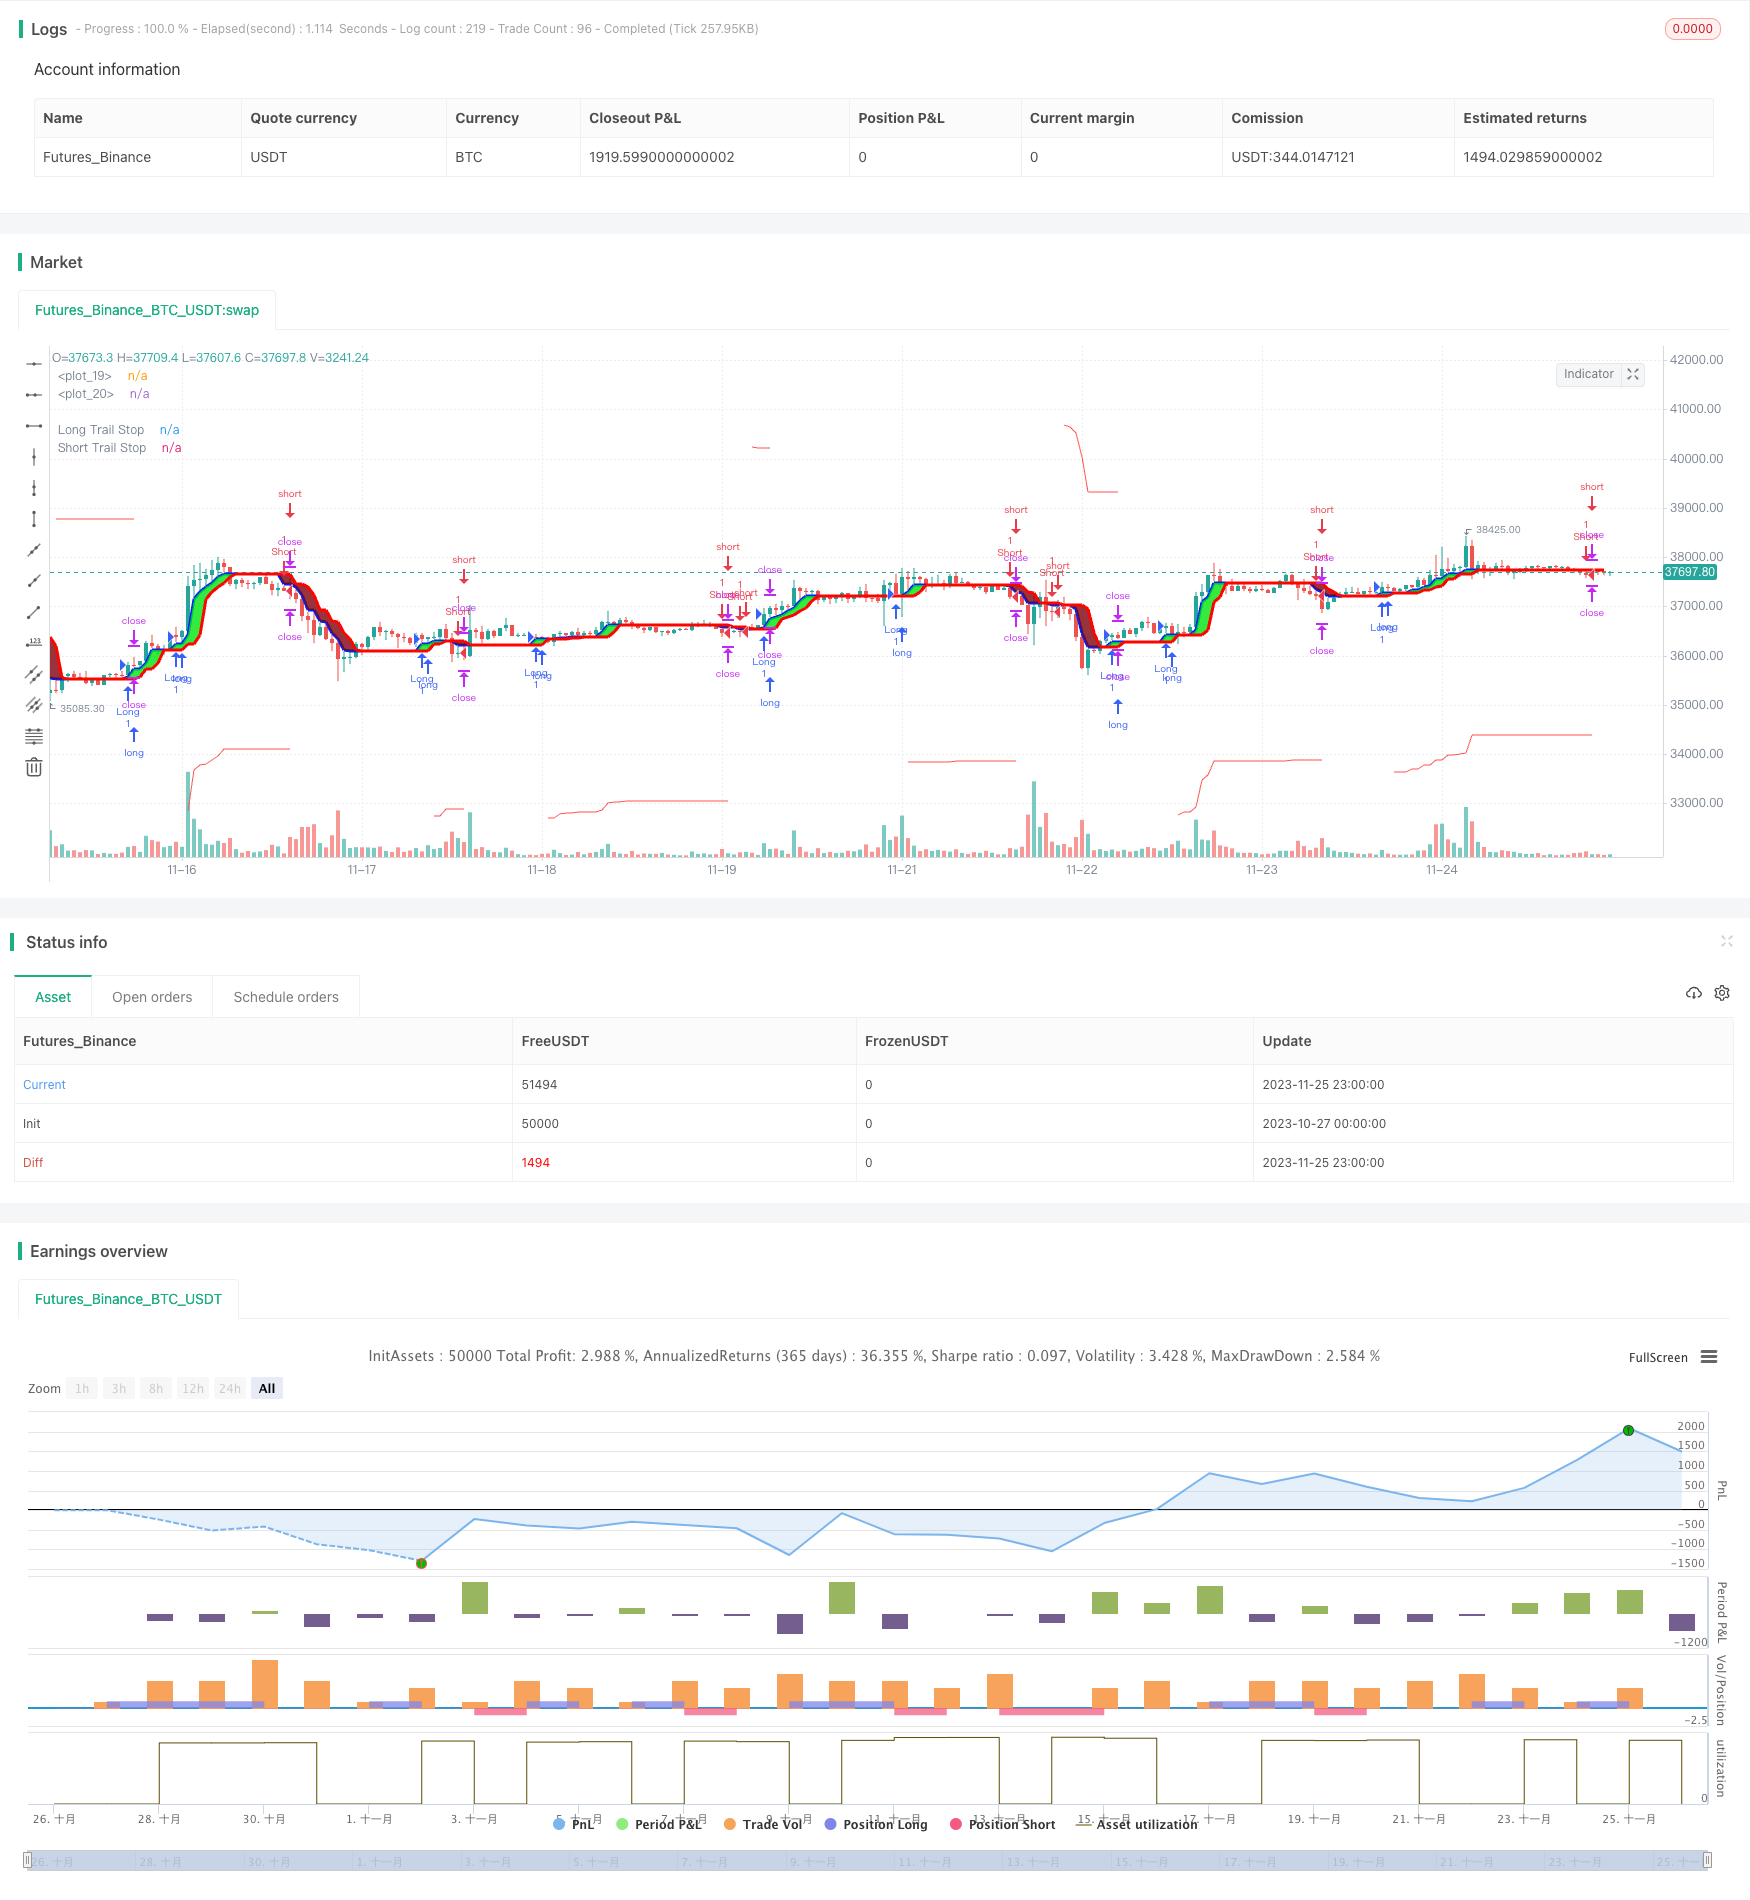
Alpha趋势跟踪止损策略是在Alpha趋势策略的基础上加入了跟踪止损机制,可以更有效地控制风险,提高整体回报率。
该策略首先利用Alpha指标判断价格趋势,当Alpha指标上扬时为看涨信号,Alpha指标下跌时为看跌信号。策略根据Alpha指标的金叉死叉来产生买入和卖出信号。
同时,策略启用了跟踪止损机制。跟踪止损值默认为当日收盘价的10%,当持有多头头寸时,如果价格下跌超过止损值则止损退出;当持有空头头寸时,如果价格上涨超过止损值则止损退出。这样可以更好地锁定盈利,降低风险。
-
Alpha趋势判断价格趋势的能力较强,效果好于普通移动平均线等指标。
-
启用跟踪止损机制,可以有效地控制单笔亏损,减少风险。
-
该策略风险控制能力较强,即使行情不利也能尽量减少损失。
-
该策略参考数较少,计算效率高,适合高频交易。
-
该策略在横盘调整时会产生较多不必要的交易信号,这会增加交易成本和滑点损失。
-
启用跟踪止损时需要合理设置止损比例,比例过大过小都不利于策略盈利。
-
标的价格剧烈波动时,会导致止损被触发的概率较大,增加了套牢风险。
-
优化止损参数时需要综合考虑标的特性、交易频率等多种因素,不能只追求最大化收益。
以上风险可以通过调整Alpha指标参数,设置DYNAMIC止损,缩短交易周期等方法进行缓解。
-
可以测试不同的指标参数,寻找更适合的Alpha指标参数组合。
-
尝试基于ATR动态设置止损幅度,使其能更好地适应市场波动。
-
可以结合其他指标筛选信号,如MACD、KD等,过滤掉一些误信号。
-
可以基于真实盘和回测结果自动优化参数,使用机器学习等技术提高参数选择的智能化。
Alpha趋势跟踪止损策略融合了趋势判断与风险控制,可以有效判别价格趋势,并锁定盈利降低风险。相比于简单的趋势跟踪策略,该策略可以获得更高的稳定收益。通过多方面的优化,有望获得更出色的绩效。
||
The Alpha Trend Strategy with Trailing Stop Loss is an enhanced version of the Alpha Trend Strategy by incorporating a trailing stop loss mechanism, which can control risks more effectively and improve overall returns.
The strategy first uses the Alpha indicator to determine price trends. When the Alpha indicator goes up, it is a bullish signal. When the Alpha indicator goes down, it is a bearish signal. The strategy generates buy and sell signals based on the golden cross and dead cross of the Alpha indicator.
Meanwhile, a trailing stop loss mechanism is enabled. The trailing stop loss level defaults to 10% of the closing price of the day. When holding long positions, if the price falls below the stop loss level, the strategy will exit the position to stop loss. Similarly for short positions. This helps better lock in profits and reduce risks.
-
The Alpha trend has stronger capabilities of determining price trends than simple moving averages and other indicators.
-
By enabling trailing stop loss, single-trade loss can be effectively controlled, lowering risks.
-
This strategy has strong risk control abilities. Even in unfavorable market conditions, losses can still be minimized.
-
With fewer reference inputs, this strategy is efficient to calculate, suitable for high frequency trading.
-
In sideways range-bound markets, the strategy may generate many unnecessary trading signals, increasing trading costs and slippage losses.
-
When enabling trailing stop loss, the stop loss percentage needs to set appropriately. An excessively high or low percentage will both be unfavorable for the strategy's profitability.
-
In violently fluctuating prices, the probability of stop loss being triggered will significantly rise, increasing the risk of being locked in positions.
-
When optimizing the stop loss parameters, various factors including the underlying's characteristics and trading frequency should be considered, not just pursuing maximum returns.
The above risks could be alleviated by adjusting the Alpha indicator parameters, setting DYNAMIC stop loss, shortening trading cycle lengths, etc.
-
Different indicator parameters can be tested to find more suitable Alpha indicator parameter combinations.
-
Attempt to set stop loss percentages dynamically based on ATR to better adapt to market fluctuations.
-
Combine with other indicators such as MACD, KD to filter out some false signals.
-
Parameters can be automatically optimized based on live trading and backtesting results, using machine learning techniques to improve the intelligence of parameter selection.
The Alpha Trend Strategy with Trailing Stop Loss combines trend determination and risk control. It can effectively identify price trends and lock in profits to reduce risks. Compared to simple trend tracking strategies, this strategy can obtain higher steady returns. With various aspects of optimization, it has the potential to achieve even better performance.
[/trans]
Strategy Arguments
| Argument | Default | Description |
|---|---|---|
| v_input_float_1 | true | Multiplier |
| v_input_1 | 14 | Common Period |
| v_input_2_close | 0 | src: close |
| v_input_3 | false | Show Signals? |
| v_input_4 | false | Change calculation (no volume data)? |
| v_input_bool_1 | true | Enable Trailing Stop (%) |
| v_input_float_2 | 10 | Trailing (%) |
Source (PineScript)
/*backtest
start: 2023-10-27 00:00:00
end: 2023-11-26 00:00:00
period: 1h
basePeriod: 15m
exchanges: [{"eid":"Futures_Binance","currency":"BTC_USDT"}]
*/

// This source code is subject to the terms of the Mozilla Public License 2.0 at https://mozilla.org/MPL/2.0/
// author © KivancOzbilgic
// developer © KivancOzbilgic
//@version=5

strategy("AlphaTrend Strategy", shorttitle='ATst', overlay=true, format=format.price, precision=2, margin_long=100, margin_short=100)
coeff = input.float(1, 'Multiplier', step=0.1)
AP = input(14, 'Common Period')
ATR = ta.sma(ta.tr, AP)
src = input(close)
showsignalsk = input(title='Show Signals?', defval=false)
novolumedata = input(title='Change calculation (no volume data)?', defval=false)
upT = low - ATR * coeff
downT = high + ATR * coeff
AlphaTrend = 0.0
AlphaTrend := (novolumedata ? ta.rsi(src, AP) >= 50 : ta.mfi(hlc3, AP) >= 50) ? upT < nz(AlphaTrend[1]) ? nz(AlphaTrend[1]) : upT : downT > nz(AlphaTrend[1]) ? nz(AlphaTrend[1]) : downT

color1 = AlphaTrend > AlphaTrend[1] ? #00E60F : AlphaTrend < AlphaTrend[1] ? #80000B : AlphaTrend[1] > AlphaTrend[3] ? #00E60F : #80000B
k1 = plot(AlphaTrend, color=color.new(#0022FC, 0), linewidth=3)
k2 = plot(AlphaTrend[2], color=color.new(#FC0400, 0), linewidth=3)

fill(k1, k2, color=color1)

buySignalk = ta.crossover(AlphaTrend, AlphaTrend[2])
sellSignalk = ta.crossunder(AlphaTrend, AlphaTrend[2])


K1 = ta.barssince(buySignalk)
K2 = ta.barssince(sellSignalk)
O1 = ta.barssince(buySignalk[1])
O2 = ta.barssince(sellSignalk[1])

plotshape(buySignalk and showsignalsk and O1 > K2 ? AlphaTrend[2] * 0.9999 : na, title='BUY', text='BUY', location=location.absolute, style=shape.labelup, size=size.tiny, color=color.new(#0022FC, 0), textcolor=color.new(color.white, 0))

plotshape(sellSignalk and showsignalsk and O2 > K1 ? AlphaTrend[2] * 1.0001 : na, title='SELL', text='SELL', location=location.absolute, style=shape.labeldown, size=size.tiny, color=color.new(color.maroon, 0), textcolor=color.new(color.white, 0))


// //ENTER SOME SETUP TRADES FOR TSL EXAMPLE
// longCondition = ta.crossover(ta.sma(close, 10), ta.sma(close, 20))
// if longCondition
//     strategy.entry('My Long Entry Id', strategy.long)

// shortCondition = ta.crossunder(ta.sma(close, 10), ta.sma(close, 20))
// if shortCondition
//     strategy.entry('My Short Entry Id', strategy.short)


longCondition = buySignalk
if (longCondition)
    strategy.entry("Long", strategy.long)

shortCondition = sellSignalk
if (shortCondition)
    strategy.entry("Short", strategy.short)


enableTrailing = input.bool(title='Enable Trailing Stop (%)',defval = true)
//TRAILING STOP CODE
trailStop = input.float(title='Trailing (%)', minval=0.0, step=0.1, defval=10) * 0.01


longStopPrice = 0.0
shortStopPrice = 0.0
longStopPrice := if strategy.position_size > 0
    stopValue = close * (1 - trailStop)
    math.max(stopValue, longStopPrice[1])
else
    0
shortStopPrice := if strategy.position_size < 0
    stopValue = close * (1 + trailStop)
    math.min(stopValue, shortStopPrice[1])
else
    999999

//PLOT TSL LINES
plot(series=strategy.position_size > 0 ? longStopPrice : na, color=color.new(color.red, 0), style=plot.style_linebr, linewidth=1, title='Long Trail Stop', offset=1, title='Long Trail Stop')
plot(series=strategy.position_size < 0 ? shortStopPrice : na, color=color.new(color.red, 0), style=plot.style_linebr, linewidth=1, title='Short Trail Stop', offset=1, title='Short Trail Stop')


if enableTrailing
    //EXIT TRADE @ TSL
    if strategy.position_size > 0
        strategy.exit(id='Close Long', stop=longStopPrice)
    if strategy.position_size < 0
        strategy.exit(id='Close Short', stop=shortStopPrice)
Detail
https://www.fmz.com/strategy/433423
Last Modified
2023-11-27 15:25:35
