2k-flavored tutorials #8
Comments
|
Update: Dan Lunt called the AR6 Fig 3.2 to my attention: This should be straightforward to do once LMR2.1 is cloud-hosted. In the interim, we can use the netCDF file for PAGES 2k (2019) that @fzhu2e generated. |

|
For this plot, use gmt_MCruns_ensemble_full_LMRv2.1.nc |
|
For the gridded fields, you may re-use the VICS dashboard code and (if it's easy) enable sliders for year selection |
|
To easily plot the LMR/PAGES2k ensemble: https://fzhu2e.github.io/pens/ or pyleoclim. |
|
@CommonClimate new notebook (with wqrts and all): https://github.com/LinkedEarth/PaleoBooks/blob/LMR-CMIP6-eVolv2k/notebooks/CMIP6_LMR.ipynb |
|
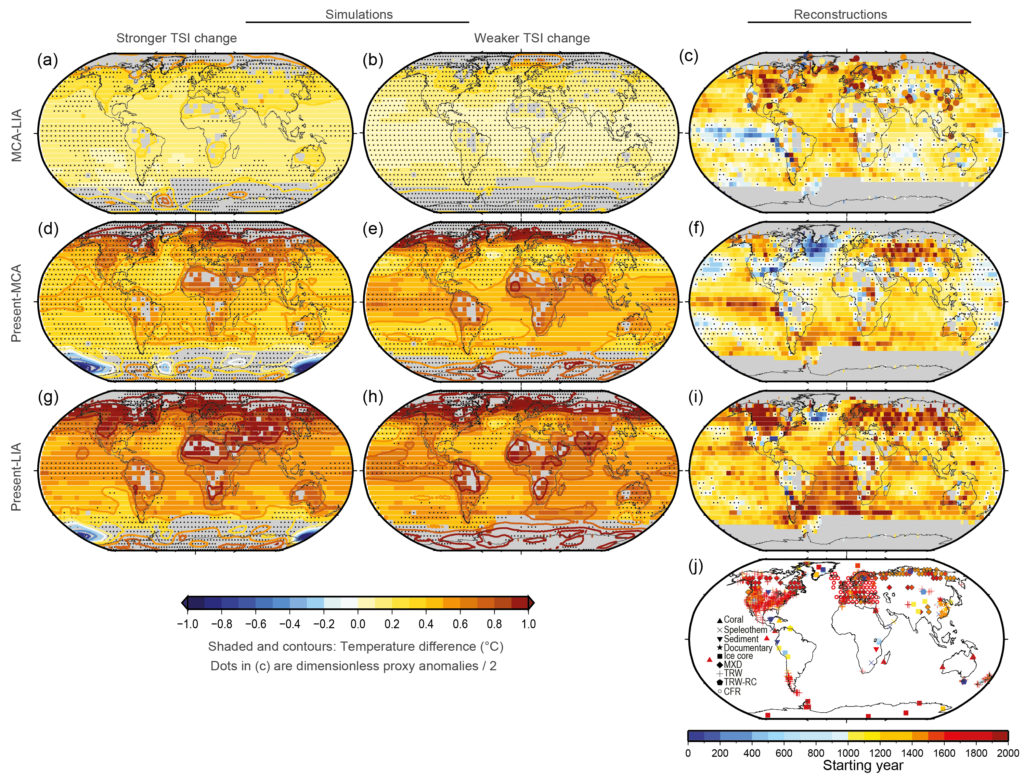
Since it's in the proposal and we have all the pieces in hand, let's have a notebook (or section of a notebook) that facilitates a comparison of simulated and reconstructed temperature fields in the spirit of [IPCC AR5 Fig 5.9]( Master word: KEEP IT SIMPLE. Just use the simulations you have vs LMR, and show how to map time slice averages, like Little Ice Age - Medieval Climate Anomaly (so 1550:1850 - 950:1250 AD; definitions vary and we could not care less, the point is to show how to easily plot time slice comparisons of PMIP4 output vs reconstructions.) That's it. No fancy science, as the science behind this particular comparison is quite lame, but the general illustration of using xarray's isel + plot capabilities for mapping will be useful enough to get re-used a bunch, I predict. @jordanplanders perhaps this would be a good time to draw up a checklist of what notebooks you have in this general area, and their % completion? |
|
I say we can close this once the CMIP6-LMR repo is published as a JupyterBook |
Hi @jordanplanders !
You will have the honor of inaugurating this repo with a brand new tutorial: Model-data comparison over the Common Era (see the "Climate of the Past Millennium" section of the proposal), leveraging recent additions to the Cloud.
Here is what @khider and I thought would be good to try:
MPI-ESM1-2-LR.past2k.r1i1p1f1past2k experiment surface air temperature data, now available in the cloud (thanks to our awesome pangeo-forge colleagues). It is available here, and I have personally tested the following code chunk:compute the area-weighted global mean surface temperature (GMST) as in this example
plot the GMST, along with evolv2k volcanic forcing (see https://zenodo.org/record/5893781). The file
eVolv2k_v3_ds_1.ncmight actually need to be pangeo-forged to the Cloud, too (apologies for verbing the noun).apply @fzhu2e 's Superposed Epoch Analysis code to it, as in Fig 4a of Zhu et al (2020), whose code is all on Zenodo. Might want to check with @fzhu2e what is the best SEA code to use at this point, since that repo is 2y old already.
finally, for completeness, we should add a
pyleoclimcapability, e.g. computing the spectrum of the GMST anomaly using MTM, plotting it, and fitting a scaling exponent (beta_est).This will serve several purposes:
The text was updated successfully, but these errors were encountered: