Certifications insights tab under Training and Certifications provides you a complete insights on various certification programs qualified by your employees. The certification insights allows you to extract the information on the popular certifications in your organization, comparing your certifications with other organizations and many other information related to the certifications.
The following list provides you the complete details that can extracted from the Certification Insights:
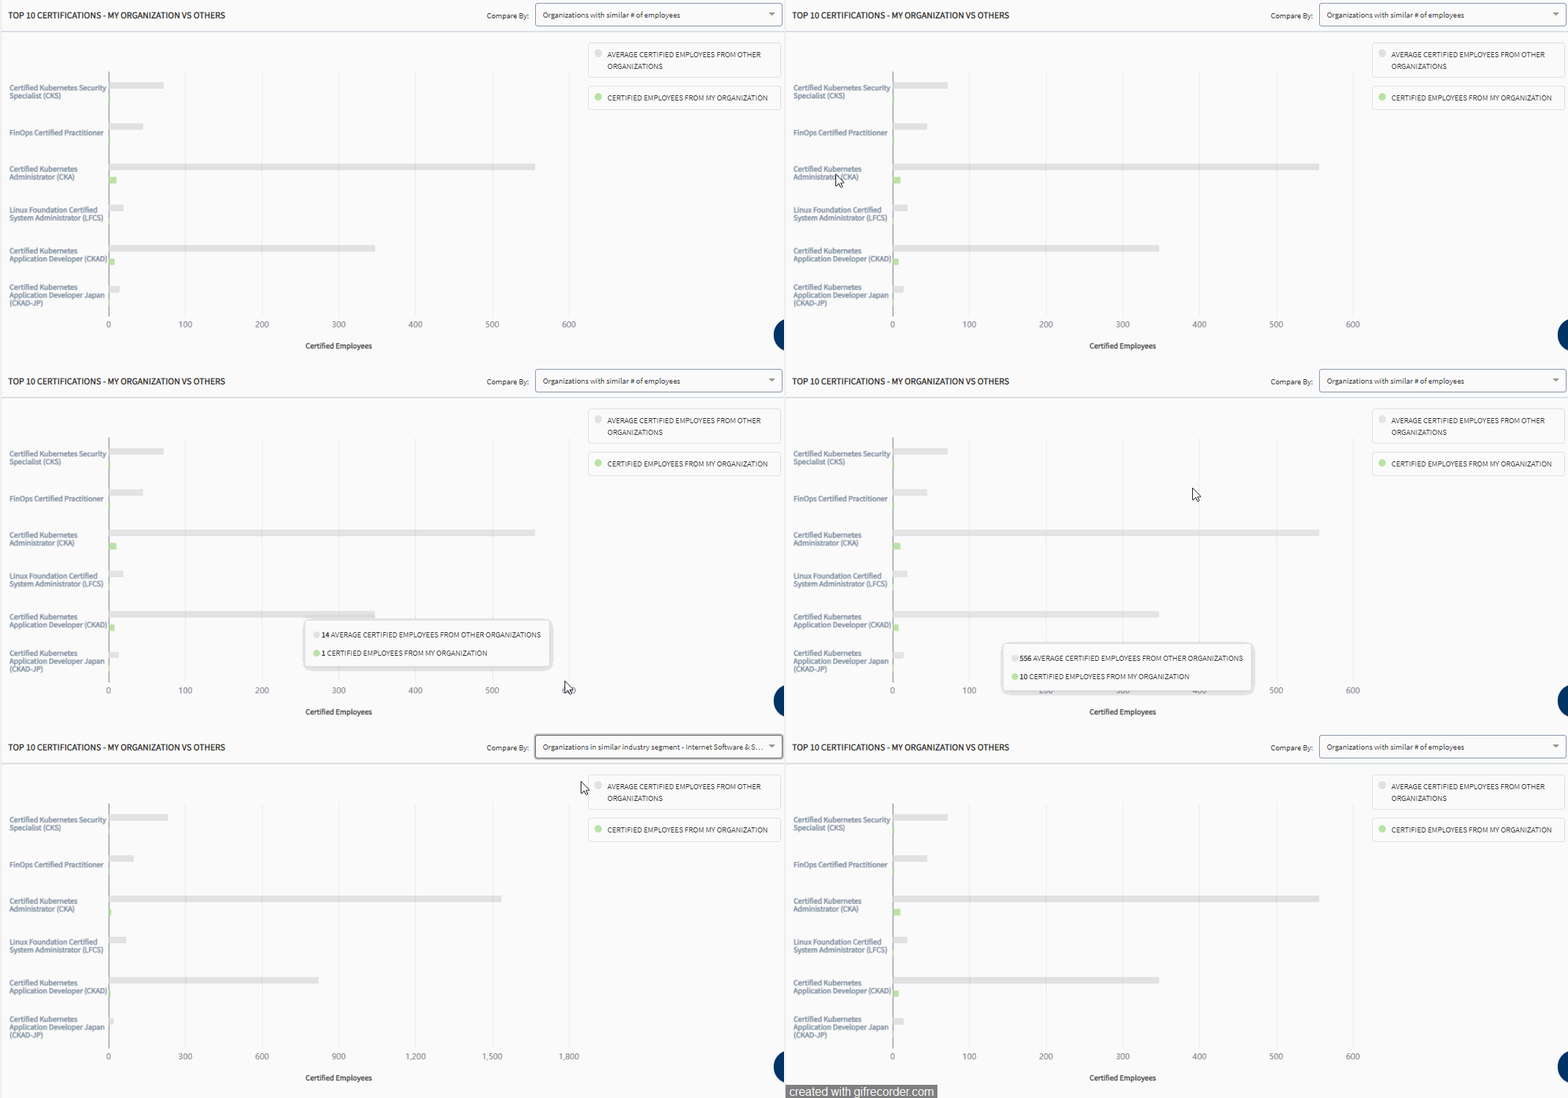
- Horizontal bar graph to compare the top 10 certifications from your organization with other organization
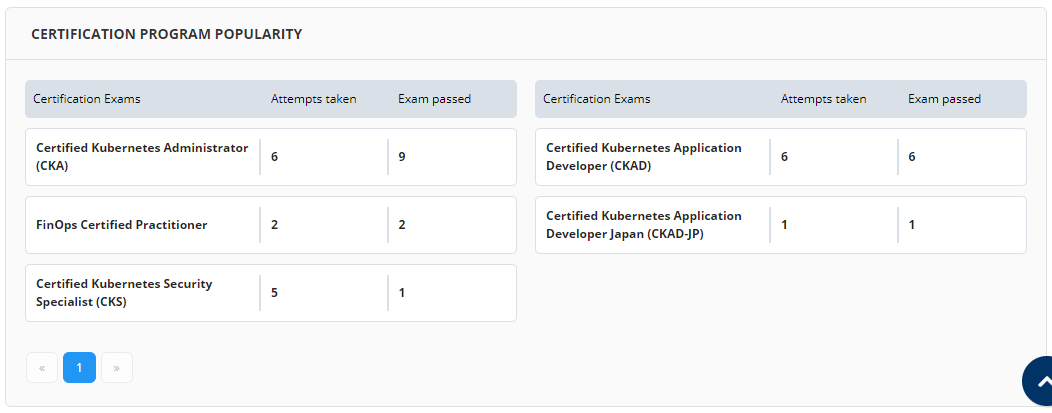
- Popular certification programs in your organization
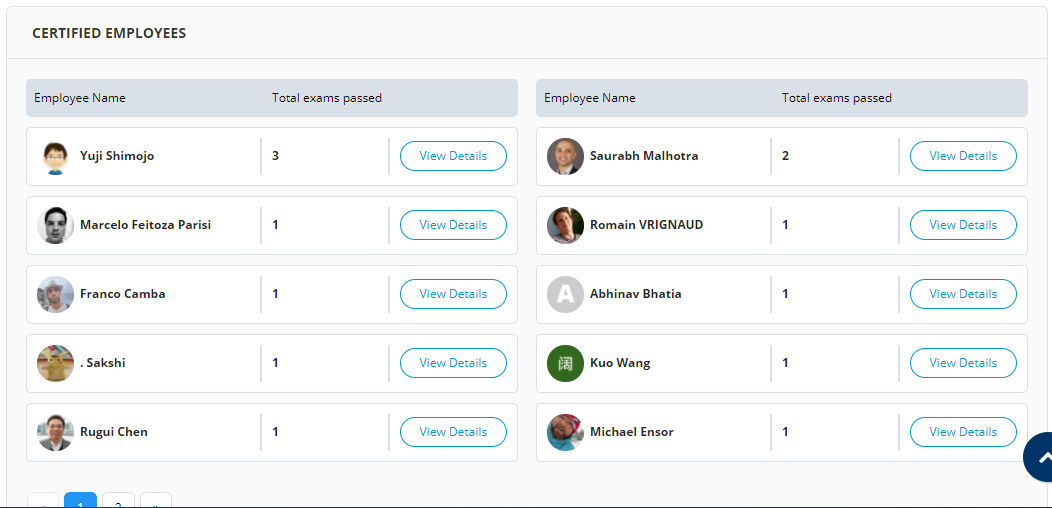
- List of certified employees in your organization
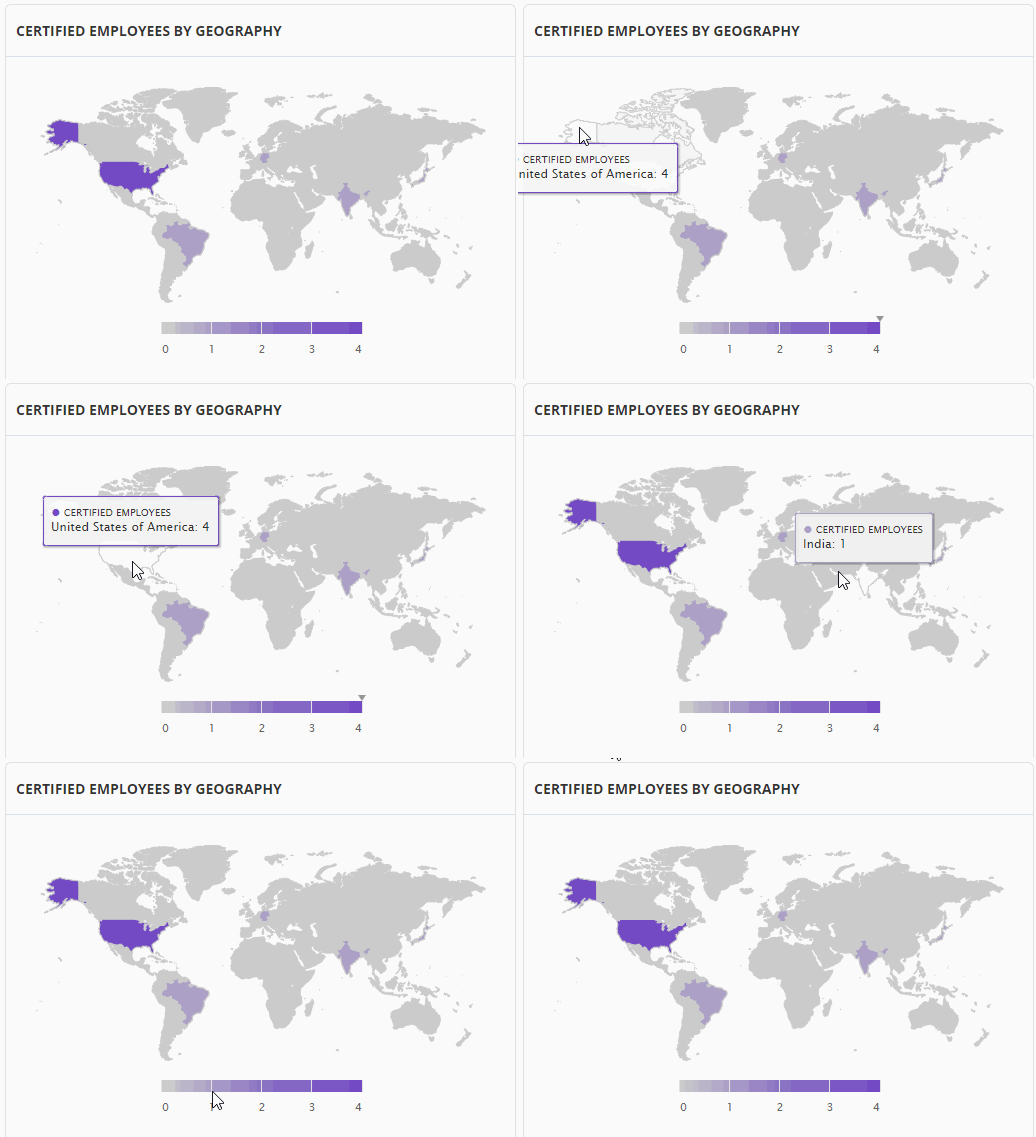
- Graphical representation of your certified employees across the geography
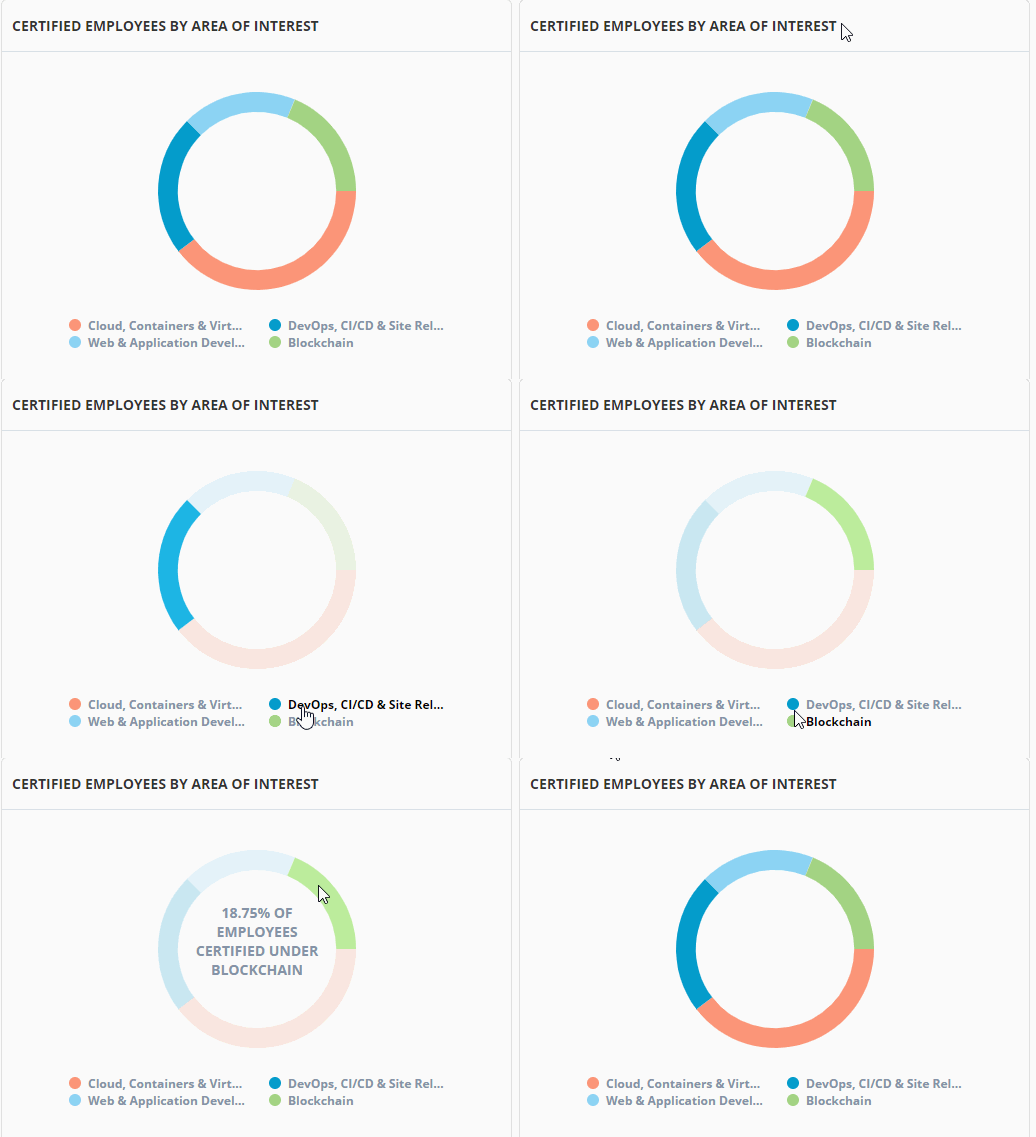
- Certified employees by area of interest
This horizontal bar graph provides you the list of top 10 certification completed by your organization versus all the organization.
You can also customize the graph based on Organization with similar number of employees, organization with similar industry segment.
This table provides you the information on the certifications that are popular in your organization. The popularity of the certification is determined based on the number of employees who have enrolled and qualified in the certification exams.
This table provides you information on Certification exams, number of attempts and exam passed.
This table provides you the information on the certified employee. The list provides details such as employee name, total number of exams passed and the certification exam details.
{% hint style="info" %} When you click View Details button, you can see a popup box that provides you details such as certification name, employee name and exam passed date . {% endhint %}
The globe graphical representation provides you a pictorial view of certified employees across all your organization scattered across the globe. If your organization has different locations which are situated across different geographical locations, with the help of this graphic you can view all your certified employees.
You can view the number of certified employees when you hover over the mouse on the different locations as well the different color code provides you with the information on the certified employees.
This donut chart provides you the percentage of certified employees based on their area of interest in different technological domains. It provides you an overview on employee percentage that are interested in perusing certification for a particular domain. Using this chart, you can identify the areas of employee interest for a particular technological domain.
When you hover over your mouse on the chart, you can see the percentage of certified employees for that particular domain.
