To produce the API for our system we used FastAPI.
FastAPI is a modern, fast (high-performance), web framework for building APIs with Python 3.7+ based on standard Python type hint. This tool is employed in the main in which, after initializing the FastAPI framework, we create endpoints for our system functionalities, such as:
- data extraction,
- music recommendations.
Running the command:
uvicorn main:app --reloadwill start the FastAPI server, and, thanks to the Swagger UI, you can interact with and explore the defined endpoints. The Swagger UI provides a user-friendly interface for testing and understanding the API functionalities. Below is a screenshot of the Swagger UI showcasing the available endpoints and their details:

To access the Swagger UI, open your web browser and navigate to:
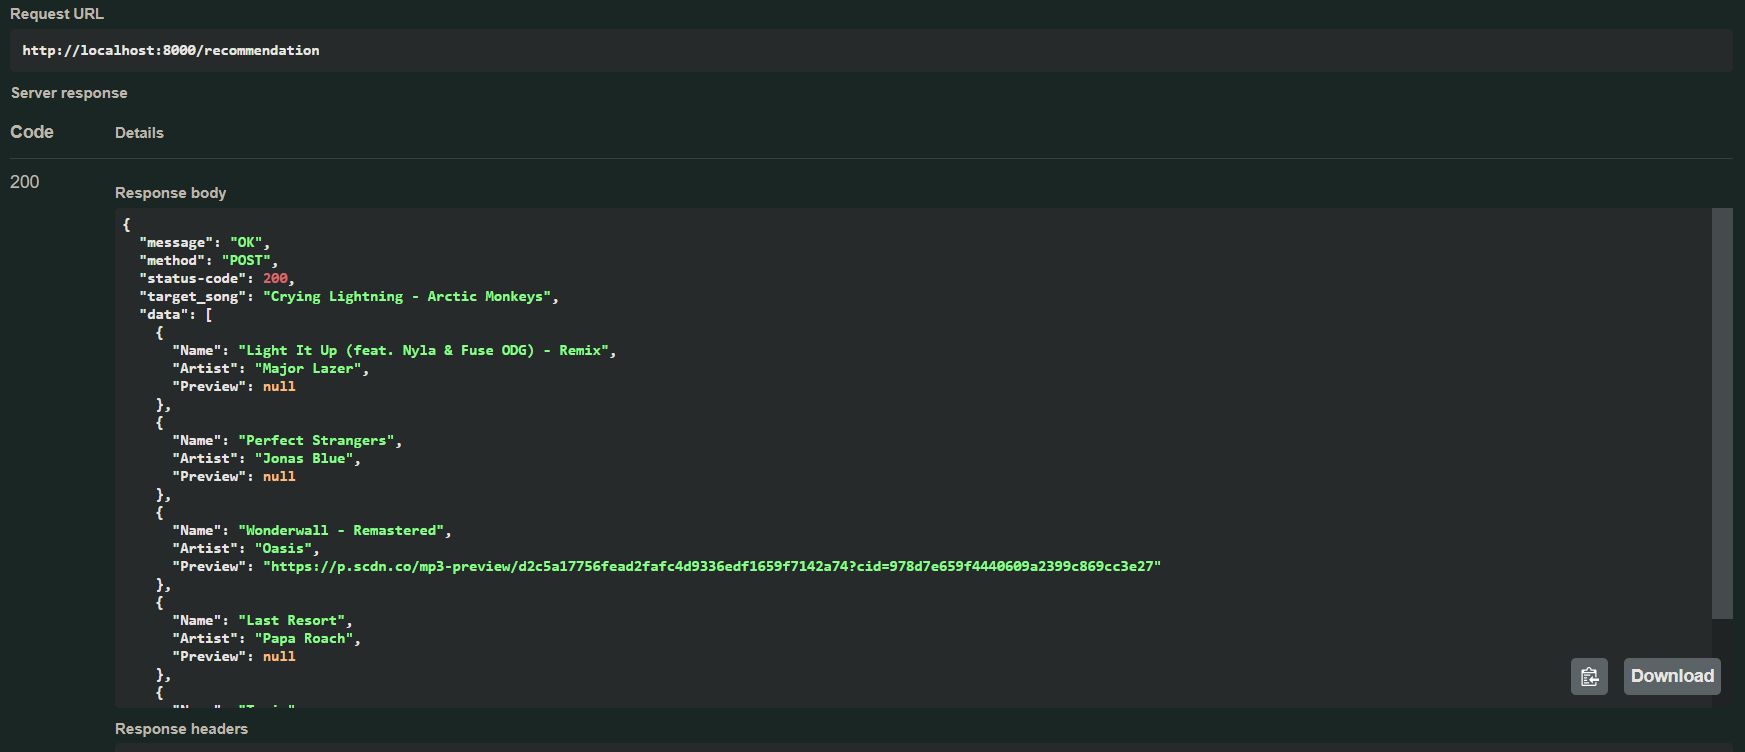
http://127.0.0.1:8000/docsThis interface dynamically documents the available endpoints, their input parameters, and allows you to make requests directly from the browser. Below an example of one of our endpoints:

Moreover, we provide an example of a potential outcome from the preceding endpoint:
More information about this tool can be found here.
In addition to the API, we also used Prometheus and Grafana for resource and performance monitoring.
Prometheus is a monitoring and alerting toolkit designed for reliability and scalability. It allows us to collect and store time-series data, allowing for real-time monitoring and alerting based on defined thresholds. Prometheus is particularly well-suited for dynamic environments such as cloud-native applications.
Instead of installing Prometheus as suggested in their Get Started Page, we used the Prometheus Docker Image by running the following command:
docker run \
  --name=prometheus \
  -p 9090:9090 \
  -v <absolute_path_to_prometheus.yml>:/etc/prometheus/prometheus.yml \
  prom/prometheus
The -v option is used to bind mount our Prometheus config file (prometheus.yml) to the Docker Image one.
After the Docker Image has been downloaded (if not already avaiable), the Prometheus UI can be accessed at at http://localhost:9090.

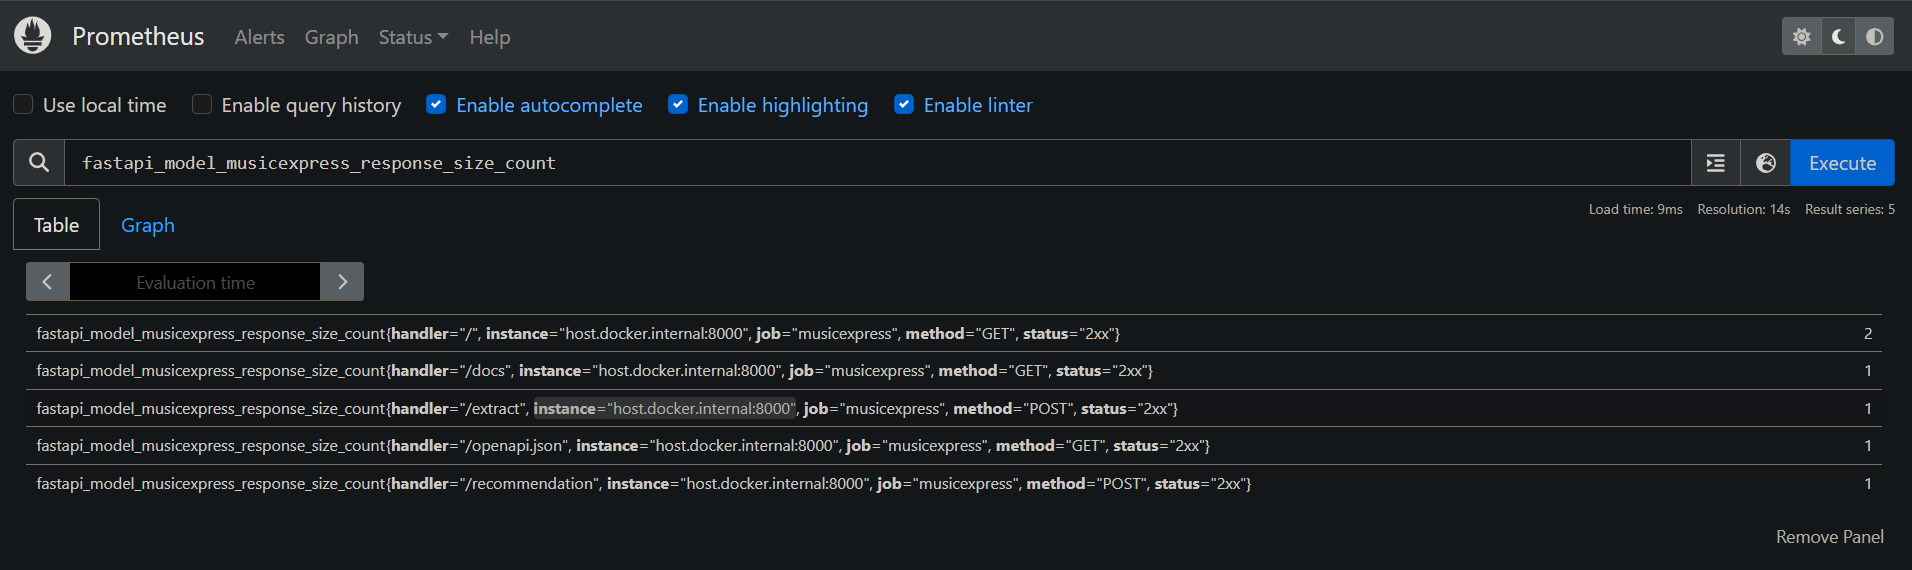
Through the Prometheus UI, we can query both default and custom metrics. In our case, we defined additional metrics in the monitoring.py file. Below is a snippet of code directly taken from the monitoring script in which we add the response_size metrics using the instrumentator object defined the prometheus_fastapi_instrumentator library. Additionally, we provide a screenshot of the results from a query that returns the values related to the response_size_count metric.
instrumentator.add(
    metrics.response_size(
        should_include_handler=True,
        should_include_method=True,
        should_include_status=True,
        metric_name="musicexpress_response_size",
        metric_namespace=NAMESPACE,
        metric_subsystem=SUBSYSTEM,
    )
)
More details on the prometheus_fastapi_instrumentator library are available here.
Grafana is an analytics and monitoring platform that integrates with various data sources, including Prometheus. Grafana provides a flexible and customizable dashboard interface in which different charts can be displayed.
Along with Prometheus, this tool is useful to create interactive and visually appealing dashboards for monitoring and analyzing system performance.
By running the following command Grafana's Docker Image will be downloaded:
docker run \
  --name=grafana \
  -p 3000:3000 \
  grafana/grafana-enterprise
After the Docker Image has been downloaded (if not already avaiable), the Grafana UI can be accessed at at http://localhost:3000. Below a screenshot of the Grafana's Welcome Page.

Through the Grafana UI, we create a dashboard to showcase the additional metrics defined for Prometheus. Utilizing charts, we display the Prometheus metrics, grouped by rows to enhance result organization.
We decided to track the following metrics:
- Total number of requests: quantifies the total number of requests
- Request Rate: measures how quickly requests are processed
- Average Latency (for both GET and POST requests): tracks the response time for user actions
- Average Request Size (for both GET and POST requests): measures the average data payload in incoming requests
- Average Response Size (for both GET and POST requests): measures the average data sent back to users in responses
These metrics provide a comprehensive view of our system's performance and usage patterns. For instance, tracking the request rate helps gauge the workload, while average latency and sizes offer insights into efficiency. Below is a screenshot of our dashboard.
