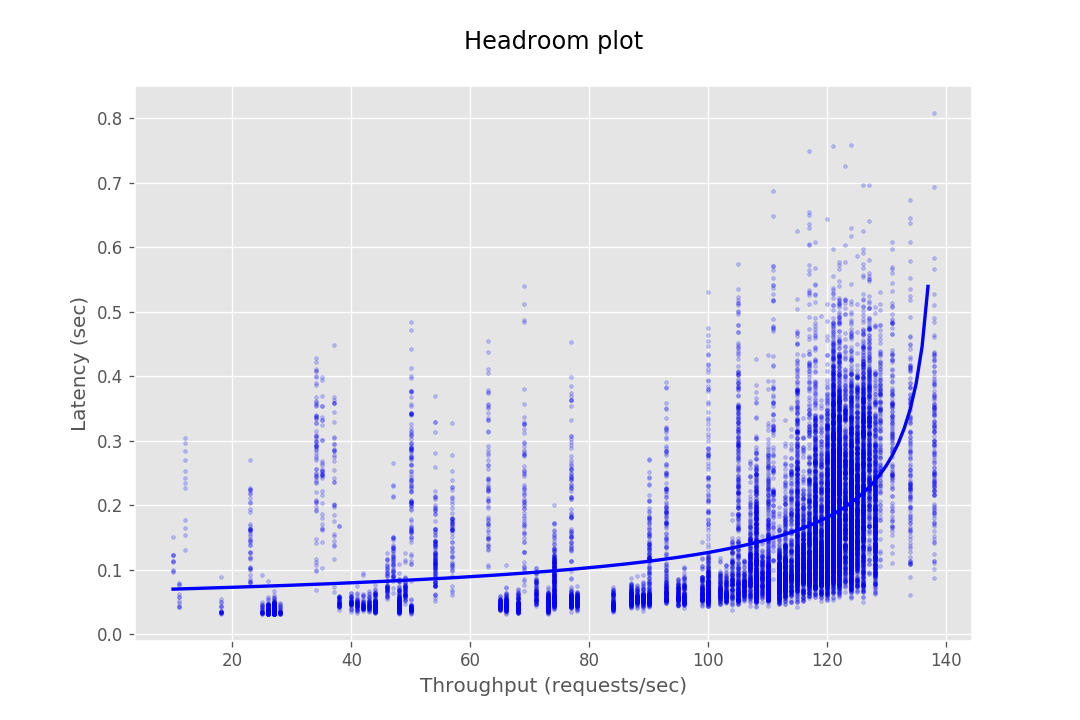
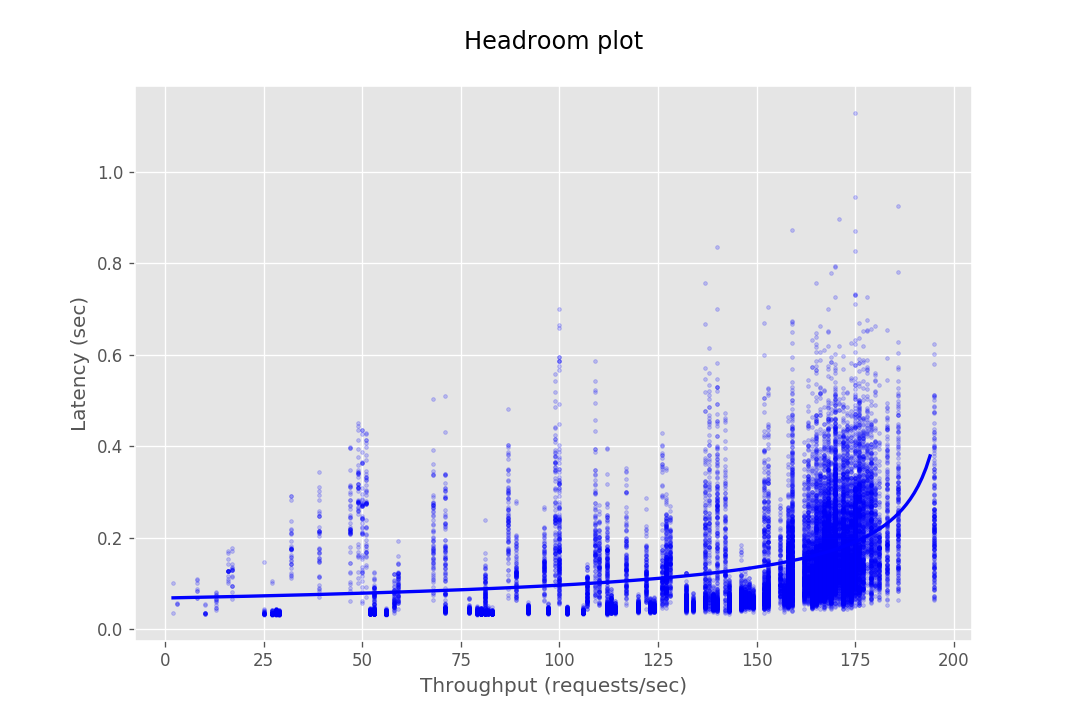
This document provides the configuration and results of a performance test of CredHub. The results should illustrate the baseline performance of a single instance, as well as the performance of a cluster of application instances as they scale horizontally. The result data are presented as Headroom Plots. These graphs show an average request latency for a given throughput. This information should inform the instance scale required to achieve a target latency based on an expected throughput requirement.
Our intention for the performance test is to validate the performance of the CredHub application itself. For this reason, the test was setup to minimize external factors. For example, we have chosen to over provision the backing database and to configure the network to minimize latency. Your results may be affected by these factors if your environment does not allow this setup.
The performance test consists of sending requests at gradually increasing levels of concurrency. The test tools are packaged as a BOSH release and deployed to a dedicated VM. Each request authenticates with CredHub via mutual TLS and performs a command, e.g. getting or setting a credential. The response latency is captured and stored in a CSV file. This CSV is then loaded into a plotting library to generate a headroom plot to visualize the data.
- Hey: A golang tool which load tests a given endpoint with a given number of requests at a given concurrency and prints the results in a csv file. We use a forked version of hey that enables mtls and start time measurement.
- Matplotlib: A python graph plotting library which is utilized to generate a headroom plot with data obtained from a provided CSV file.
- CredHub Perf Release: A BOSH release which packages Hey to create load from a deployed instance.
| Property | Value |
|---|---|
| Instance Type | m4.large |
| CPU | 2 core |
| RAM | 8 GiB |
| Encryption Provider | Internal |
| Authentication | Mutual TLS |
| CredHub Max Heap Size | 7 GB |
| Database TLS Enabled | False |
| CredHub ACLs Enabled | False |
| CredHub Version | 1.3.0 |
| Property | Setting |
|---|---|
| Instance Type | RDS db.m4.2xlarge |
| CPU | 8 core |
| RAM | 32 GiB |
| Allocated Storage | 50 GiB |
| Engine | Postgres 9.4.11 |
| Multi AZ | False |
| Storage Type | gp2 |
| Property | Setting |
|---|---|
| Instance Type | m4.large |
| CPU | 2 core |
| RAM | 8 GiB |
All the VMs are deployed in the same AZ on AWS. The CredHub instances are deployed behind an AWS elastic load balancer. The database is in the same AWS region, however, the instances access it via a public address.
The client and server TLS connections are terminated in the application and not in load balancers or a TLS termination proxy.
Before every run of the performance test, the database is seeded with the JSON credentials which shall be tested against. After every run of the performance test, the database is truncated to ensure each run is clean and unaffected by previous runs.
A single credential is set or retrieved in the get and set request tests. The interpolate tests retrieve and interpolate 3 credential values into a request json object per request.
| Request Type | Instances | Number of Requests/Step | Concurrency Step | Min Concurrency | Max Concurrency | Total Requests |
|---|---|---|---|---|---|---|
| Get | 1, 2, 4 | 500 | 1 | 1 | 60 | 30000 |
| 10 | 500 | 1 | 1 | 120 | 60000 | |
| Set | 1, 2, 4 | 500 | 1 | 1 | 40 | 20000 |
| 10 | 500 | 1 | 1 | 80 | 40000 | |
| Interpolate | 1, 2, 4 | 500 | 1 | 1 | 50 | 25000 |
| 10 | 500 | 1 | 1 | 100 | 50000 |
| Instances | Get | Set | Interpolate |
|---|---|---|---|
| 1 | 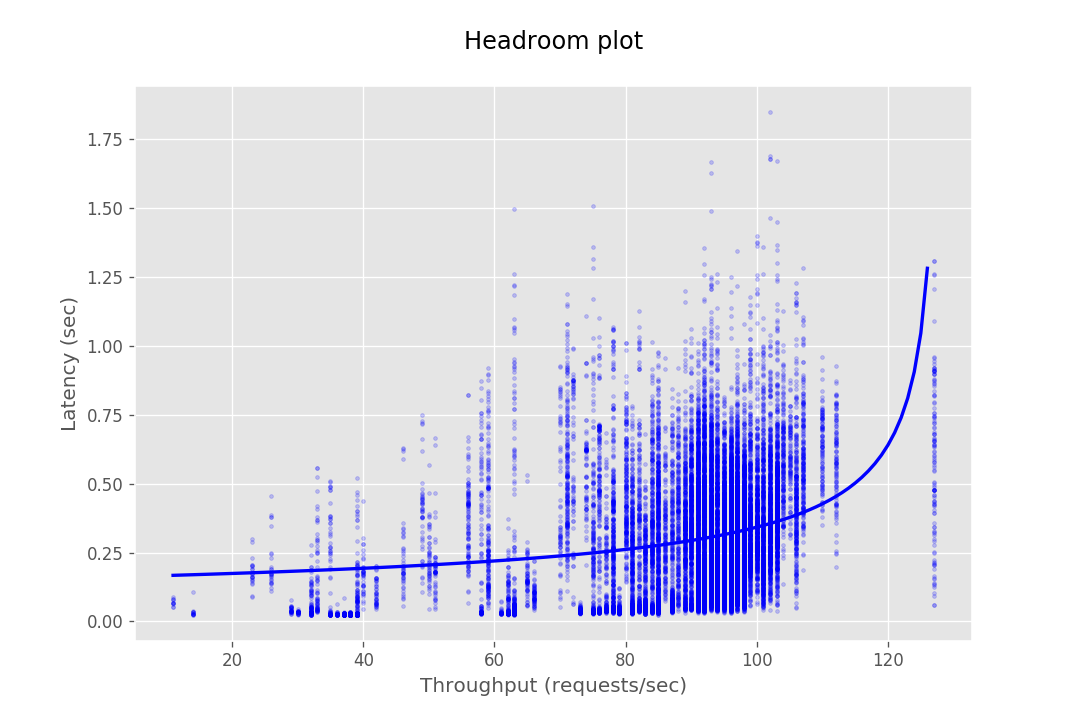 |
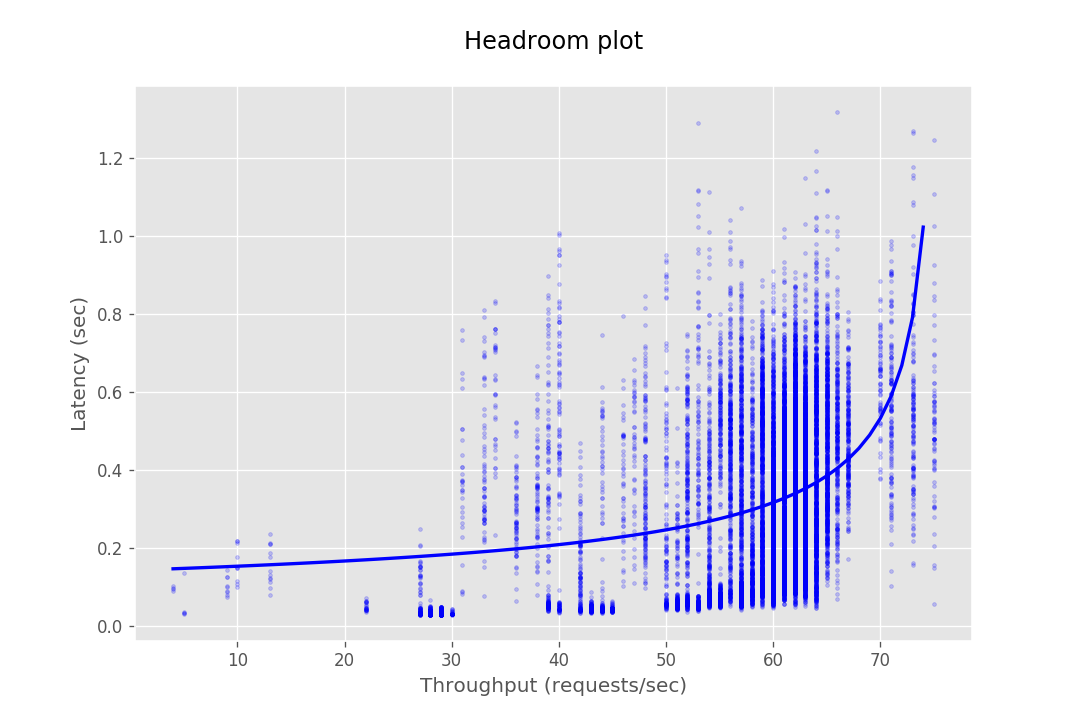 |
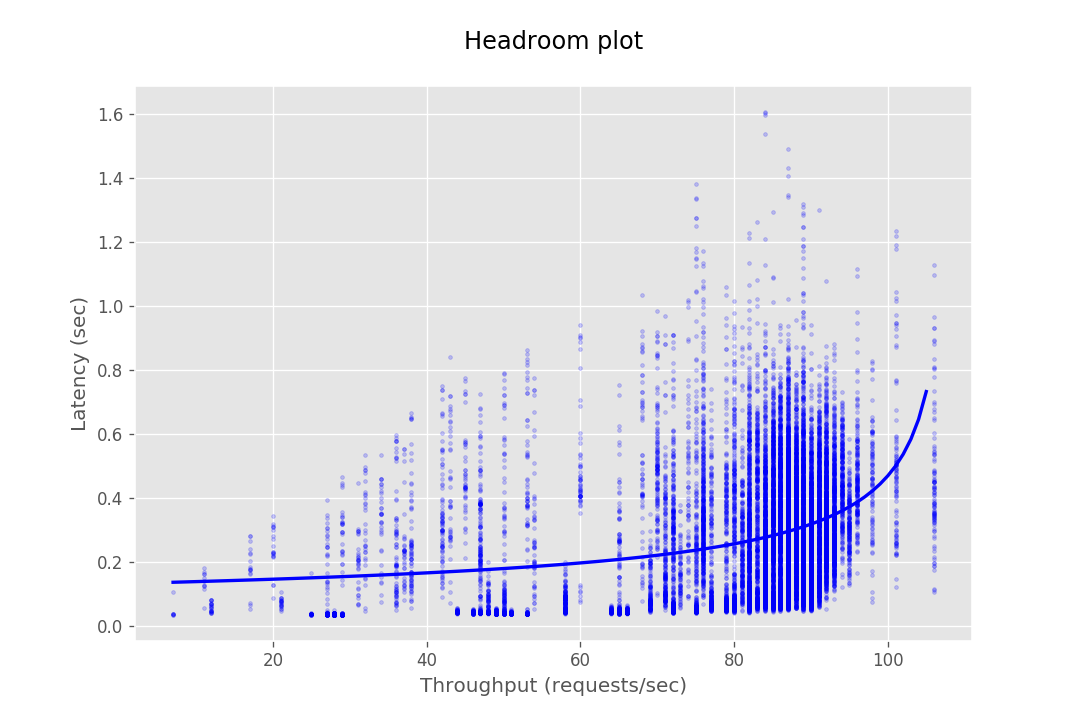 |
| 2 | 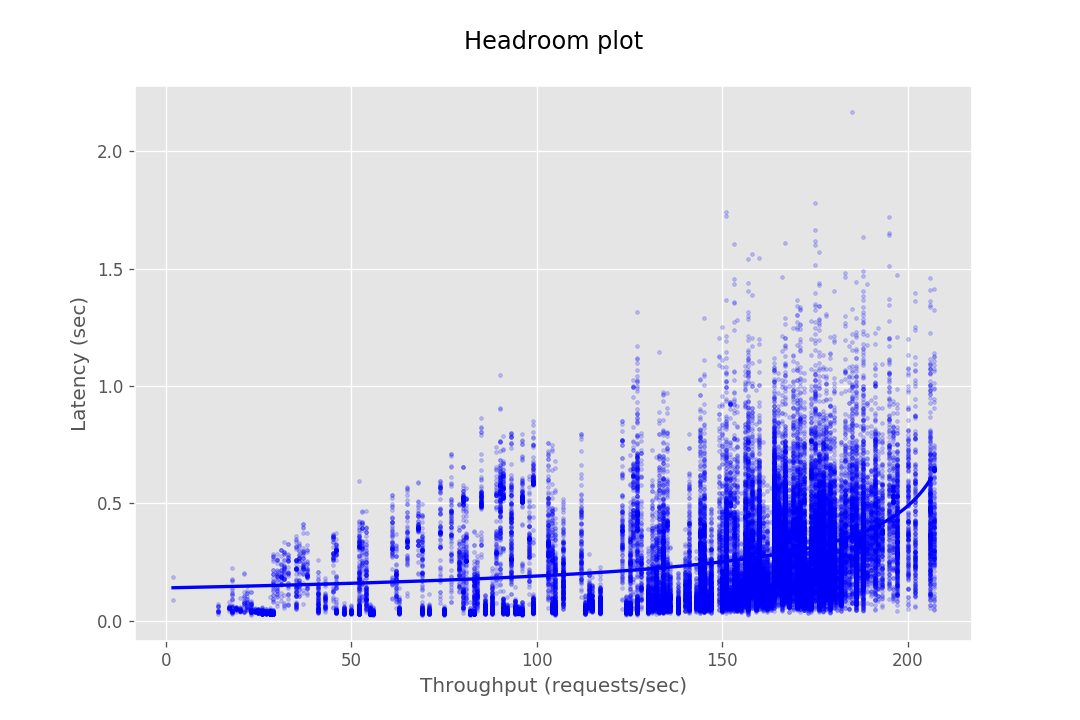 |
 |
 |
| 4 | 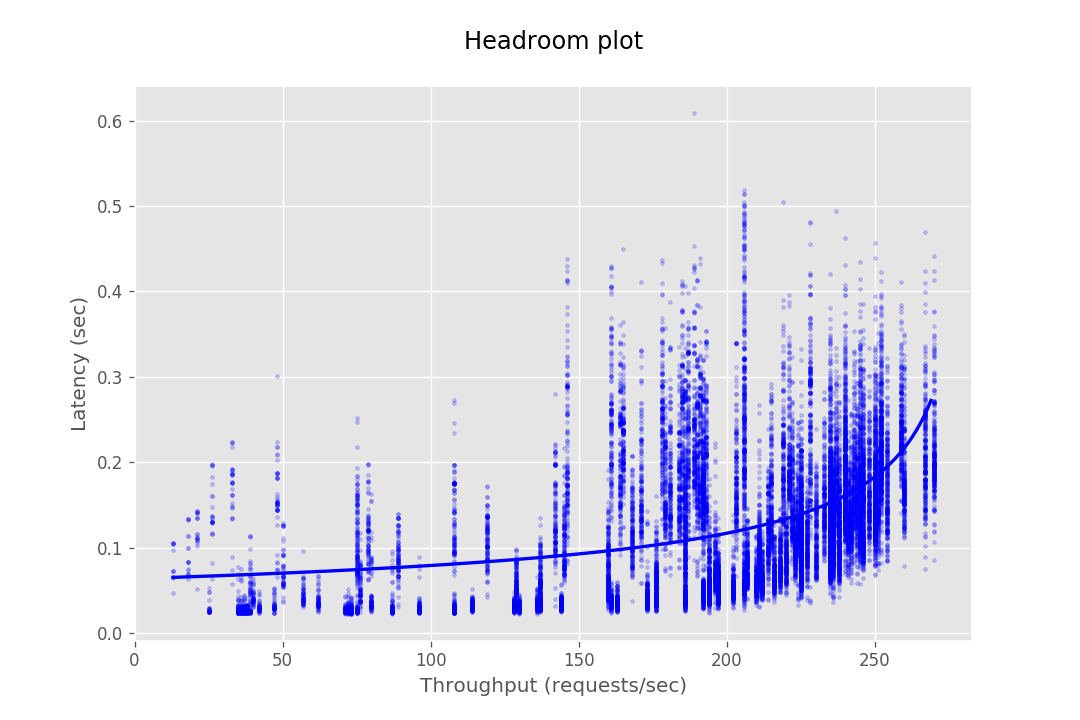 |
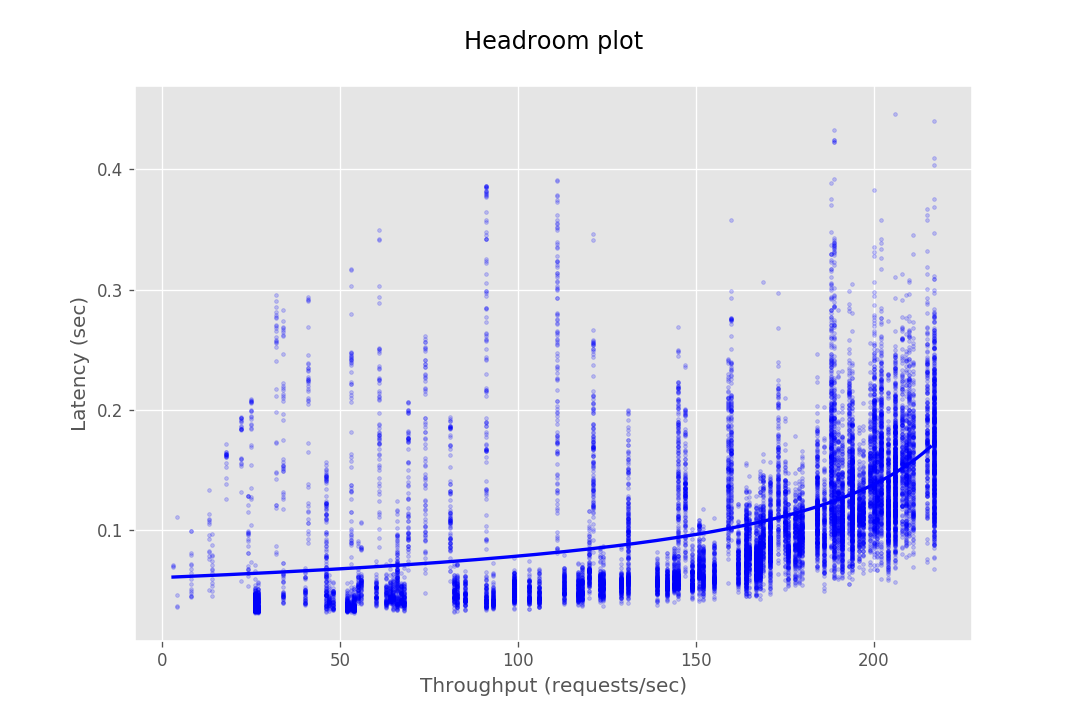 |
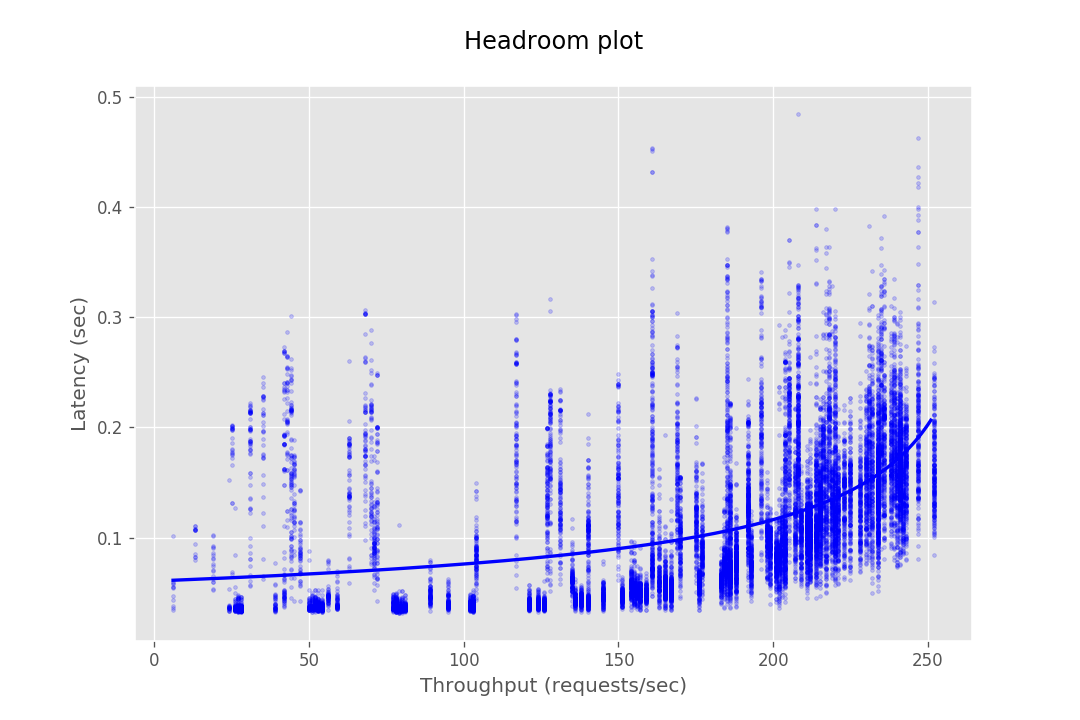 |
| 10 | 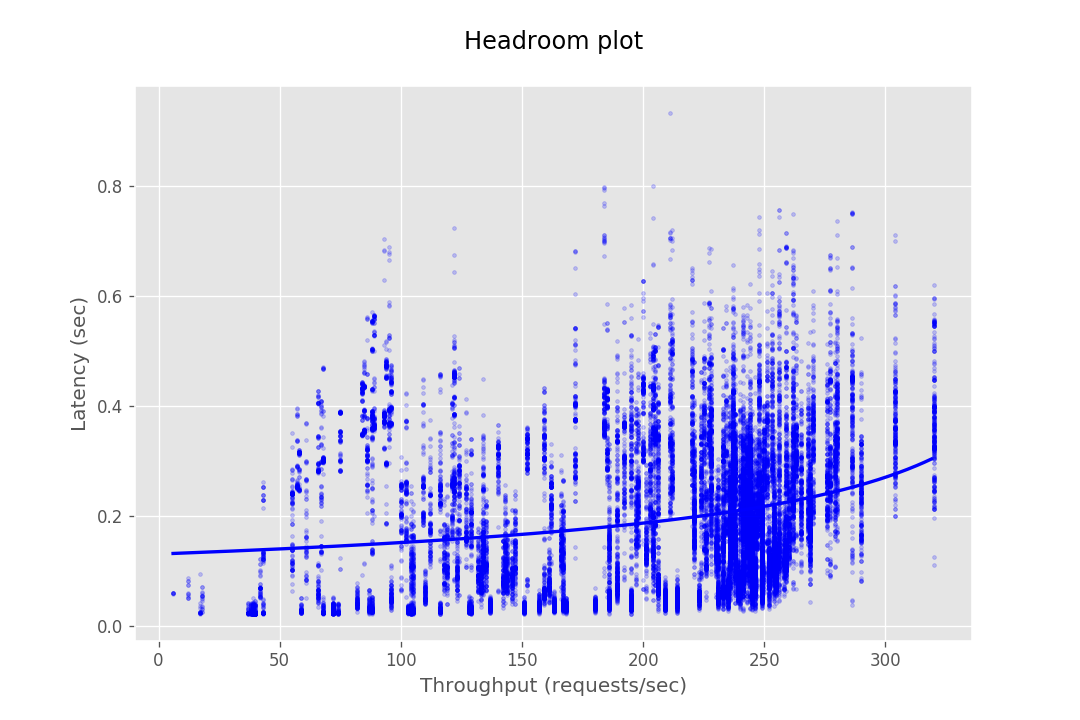 |
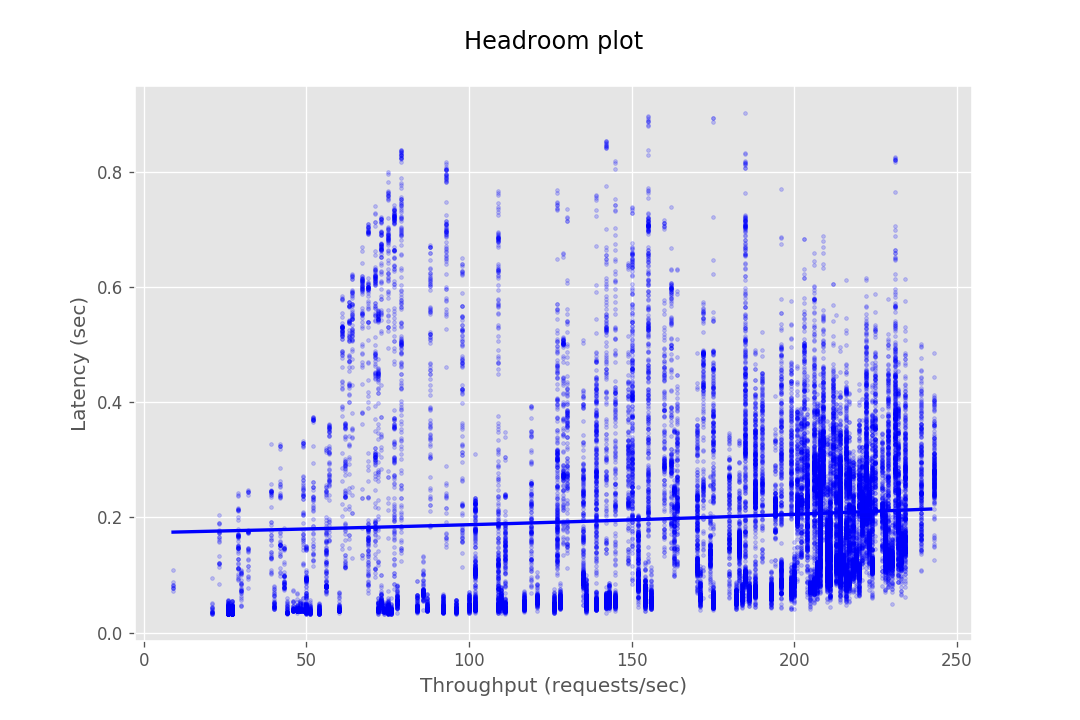 |
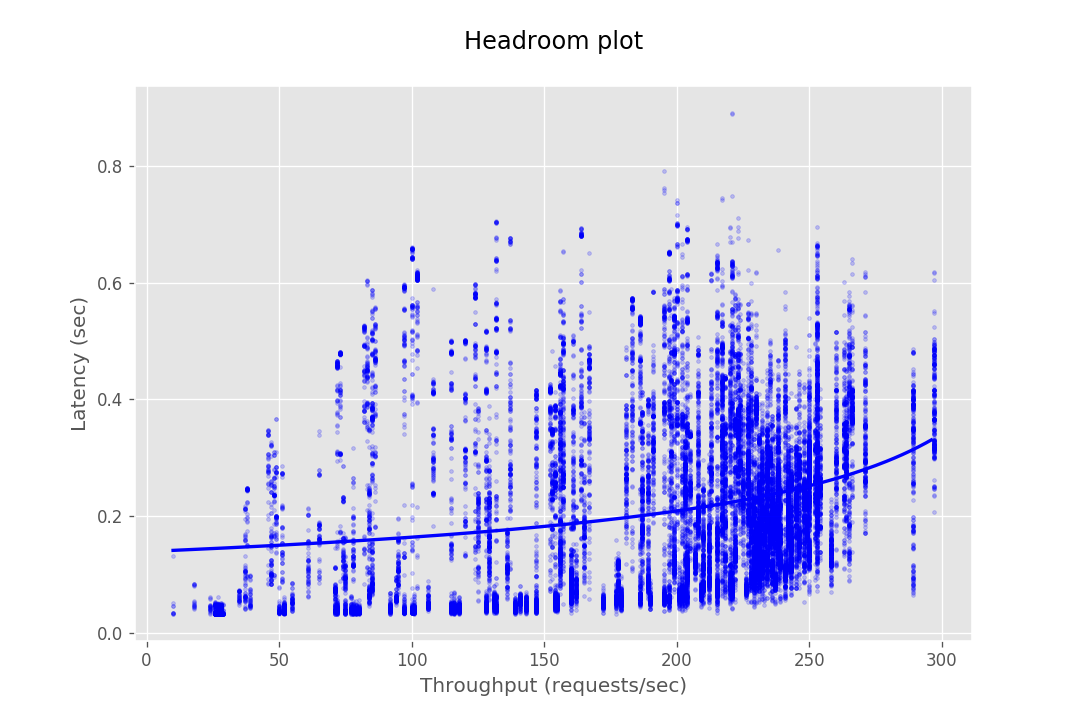 |
At this stage, the database cannot serve most requests from CredHub as it gets bottle-necked by its connection pool. Hence the maximum throughput in the case of 10 instances is not very different from the of 4 instances.
The concurrency and request values selected for the above tests were determined by experimenting with different values and combinations of parameters. The goal when selecting these parameters is to arrive at a configuration that provides sufficient load to evaluate throughput and latency of the instances while they are functioning normally. We aim to avoid values that will overwhelm the instances to the point of failure or provide too little traffic, because these will not provide meaningful data.
The examples below under the 'Bad Config' heading show results where poor parameters were chosen, which lead to obscure results. These were resolved by adjusting request and concurrency settings to better fit the instance capacity. Some graphs, like shown under 'Outlier Data Point' may seem like bad results due to a few outlier data points. These outliers are often caused by network anomalies, which will not appear when the same parameters are run a subsequent time. In addition, you may encounter results that seem entirely unpredictable and seemingly absurd. In our experience this usually happens when the system is testing with parameters that cause the underlying system to throttle. This leads to heavy clustering of data point in the middle of the graph accompanied with what would appear to be very poor performance.
A relatively certain way of determining consistently good parameters is to start at small values of max concurrency (eg. 20) and increasing it in steps of 5 while running performance tests against a single CredHub instance. Keep repeating this exercise until the performance seems to fall consistently for almost every run. This method, though tedious, ensures accurate test parameters are observed. We found that 500 requests per step is a reasonable balance to find accurate results per step while ensuring the test does not take too much time to run.
| Bad Config | Outlier Data Point |
|---|---|
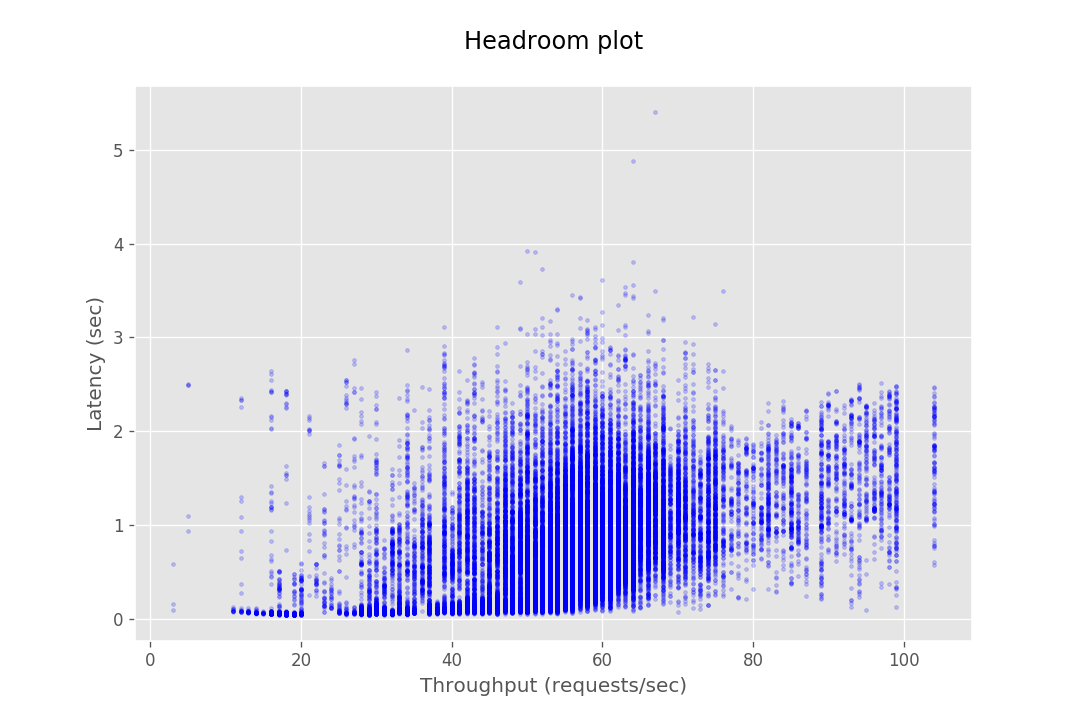 |
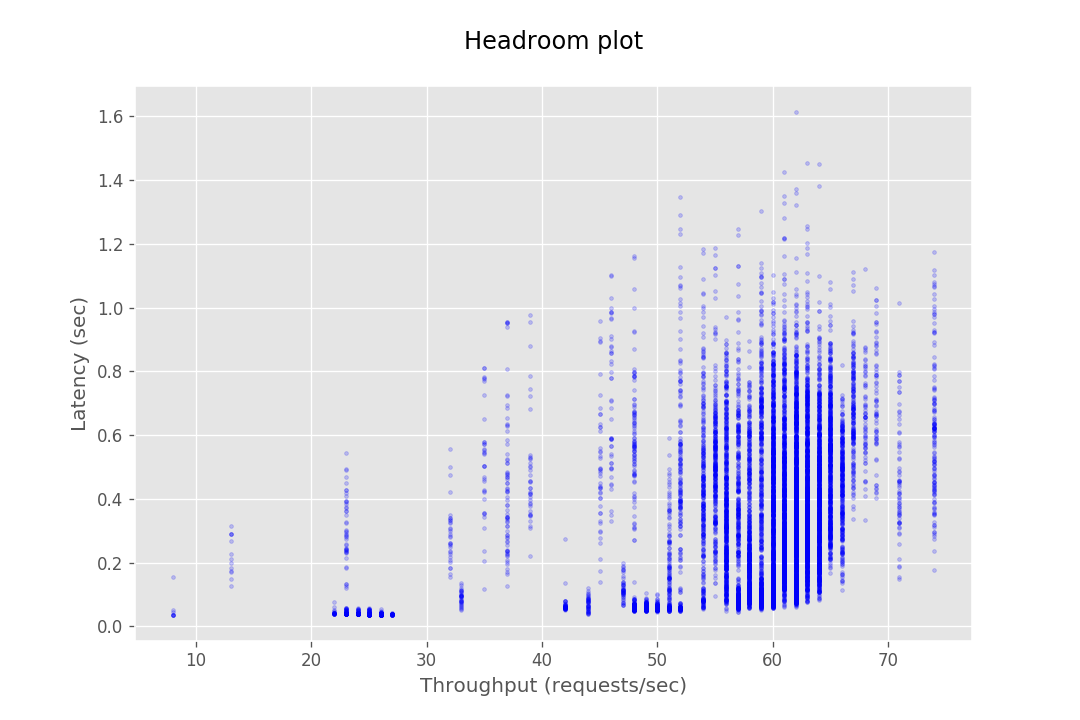 |
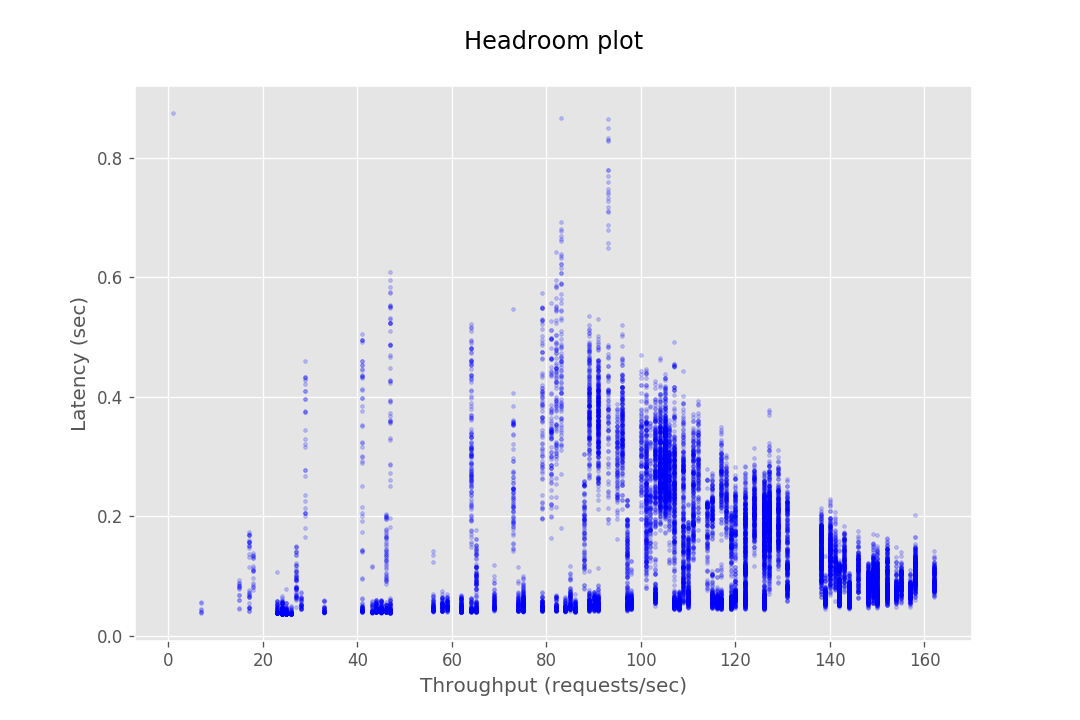 |
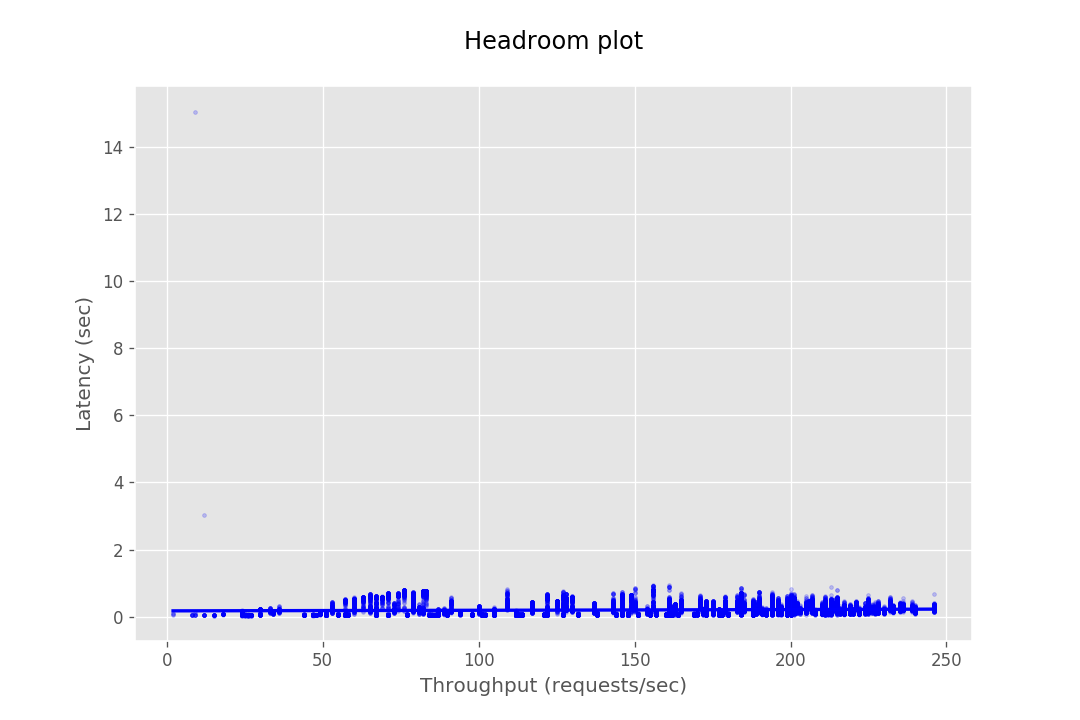 |
The tools required to performance test the CredHub performance setup are available here.
Follow the instructions provided in the README to both run the tests and process the test output into Headroom Plots.