Screenshots
Regulating Temperature
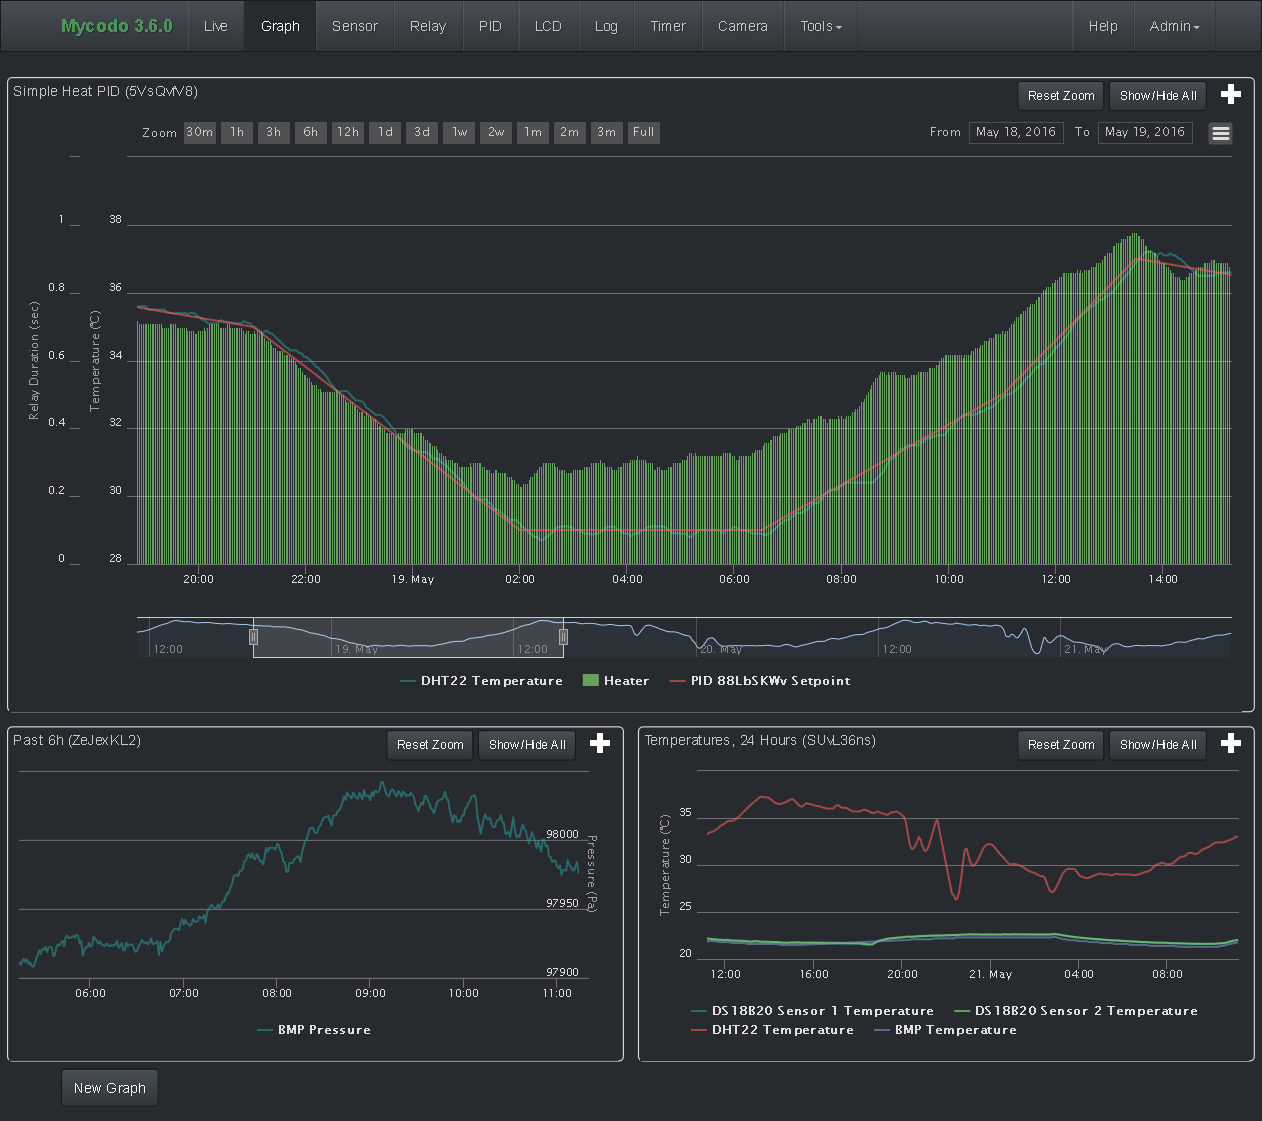
The top graph of the above screenshot visualizes the regulation of temperature in a sealed chamber. The red line is the desired temperature setpoint that has been configured (which also happens to have been configured to change over the course of each day). The blue line is the actual recorded temperature. The green vertical bars represent how long a heater is activated for, per every 20-second period. This regulation was achieved with minimal tuning (Actual tuned gains: KP=0.08, KI=0.005, KD=0.001), and already displays a very minimal deviation from the setpoint (±0.5° Celsius). Further tuning would reduce this variability even more.
Live Data

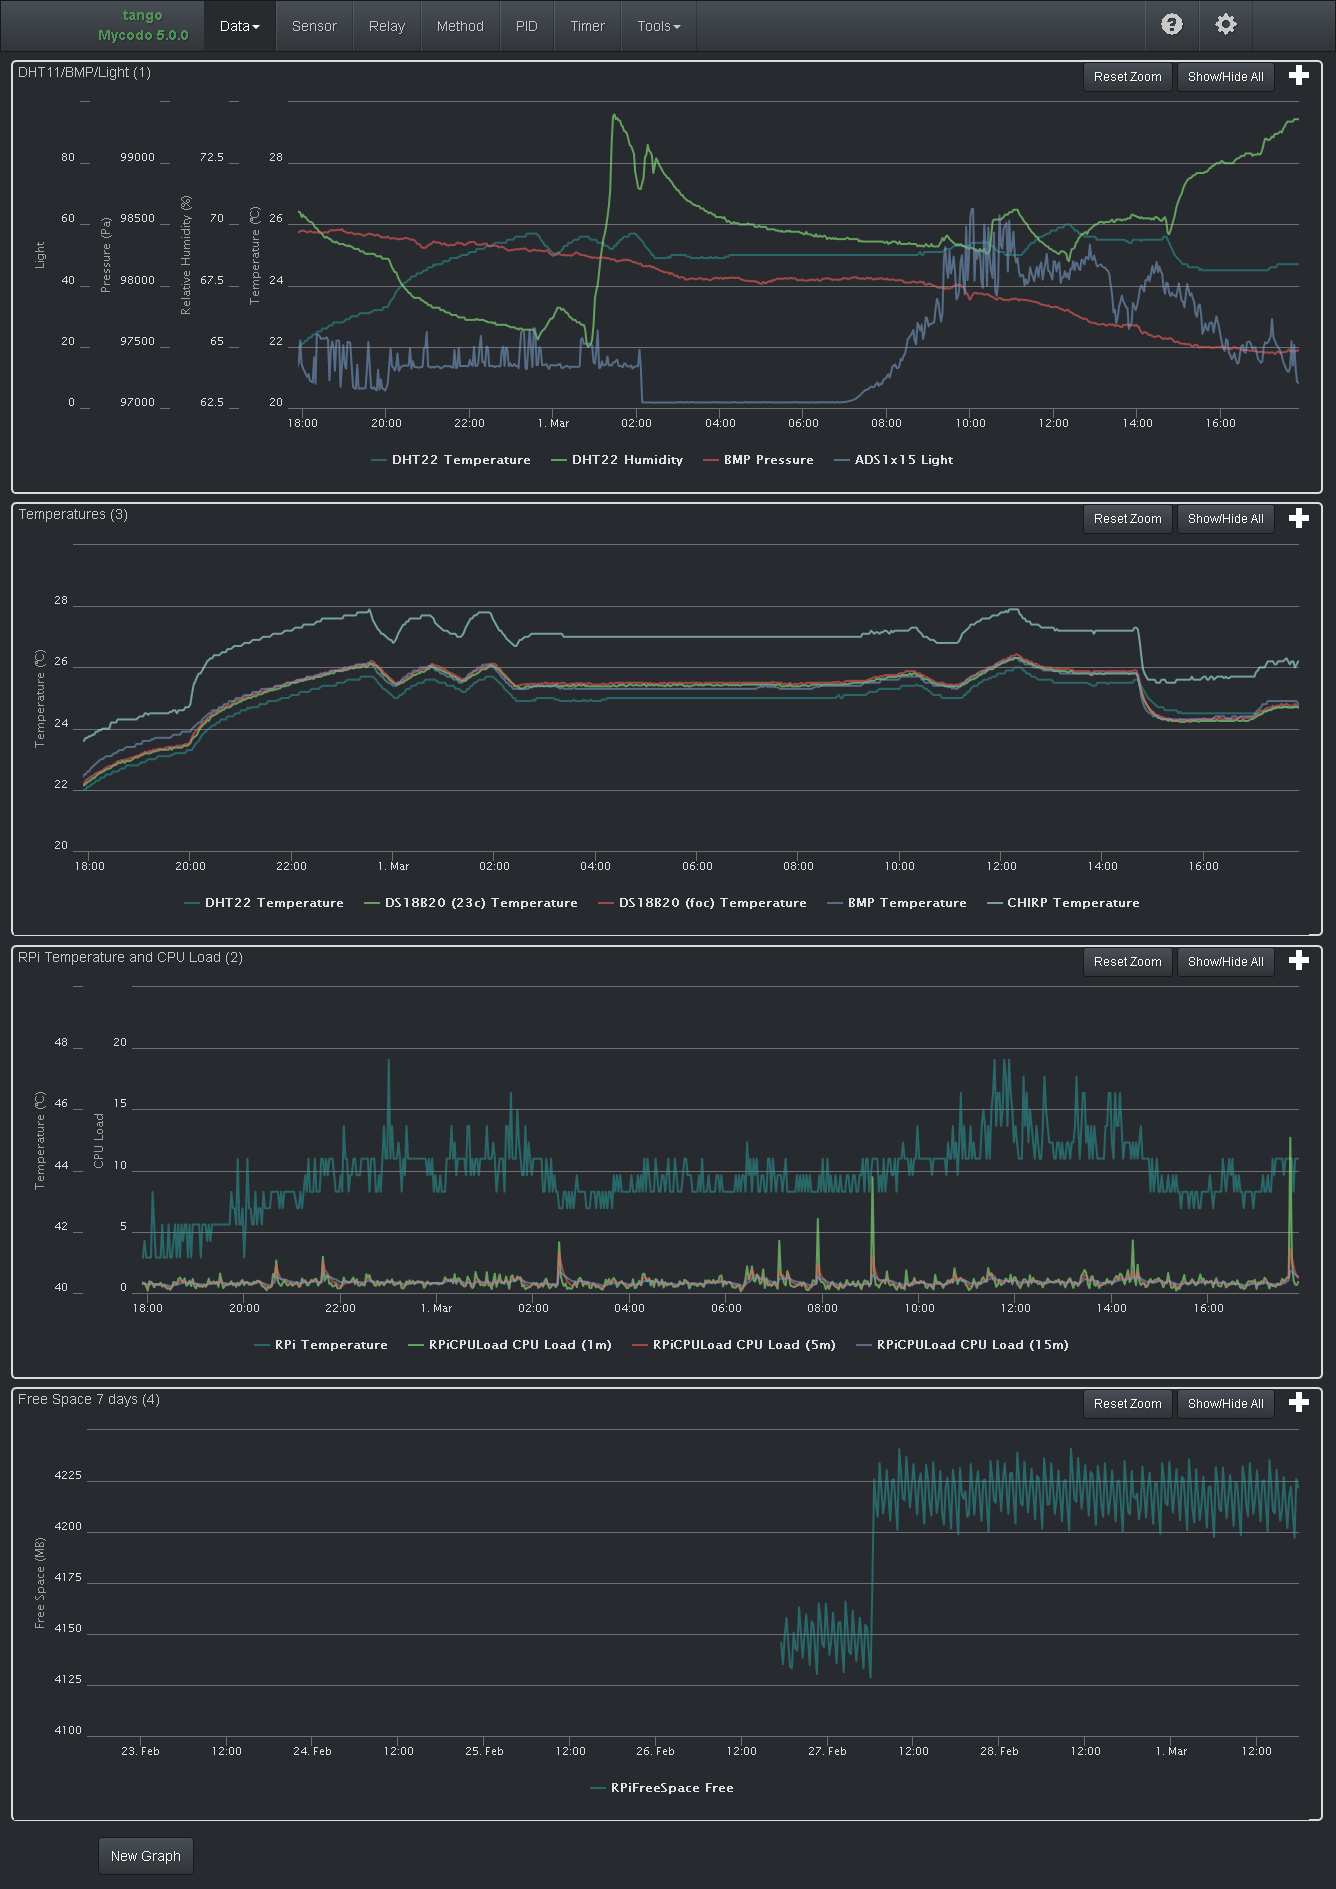
Live Graphs
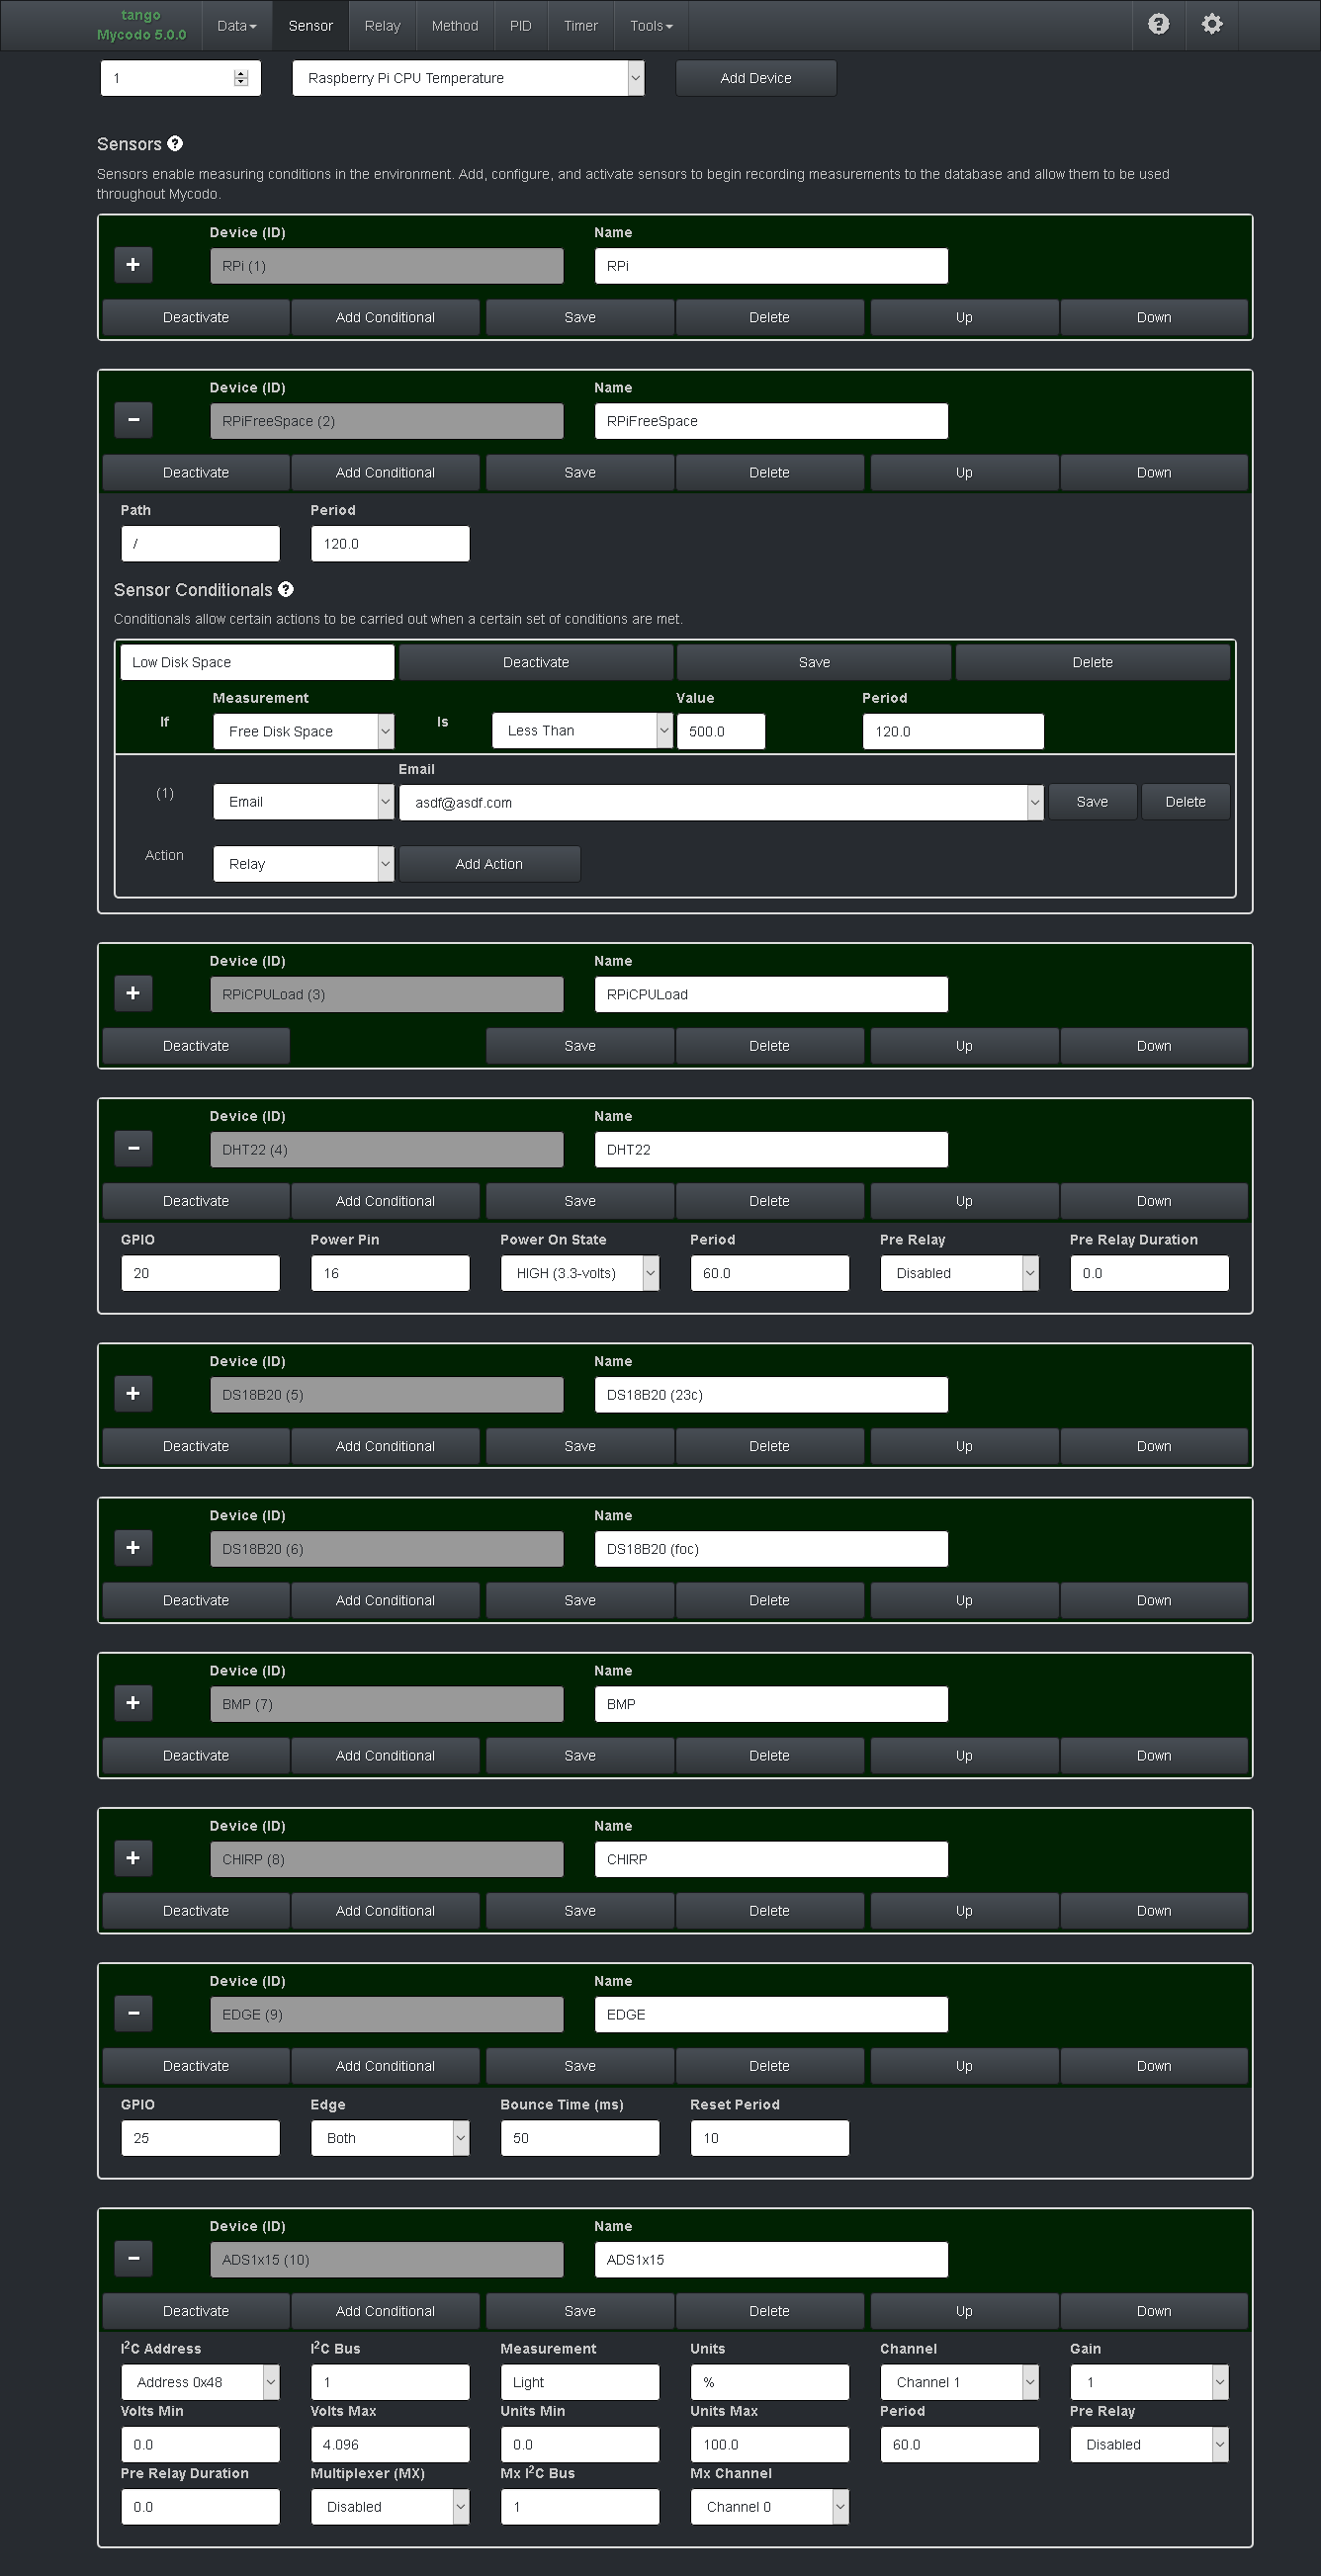
Sensors
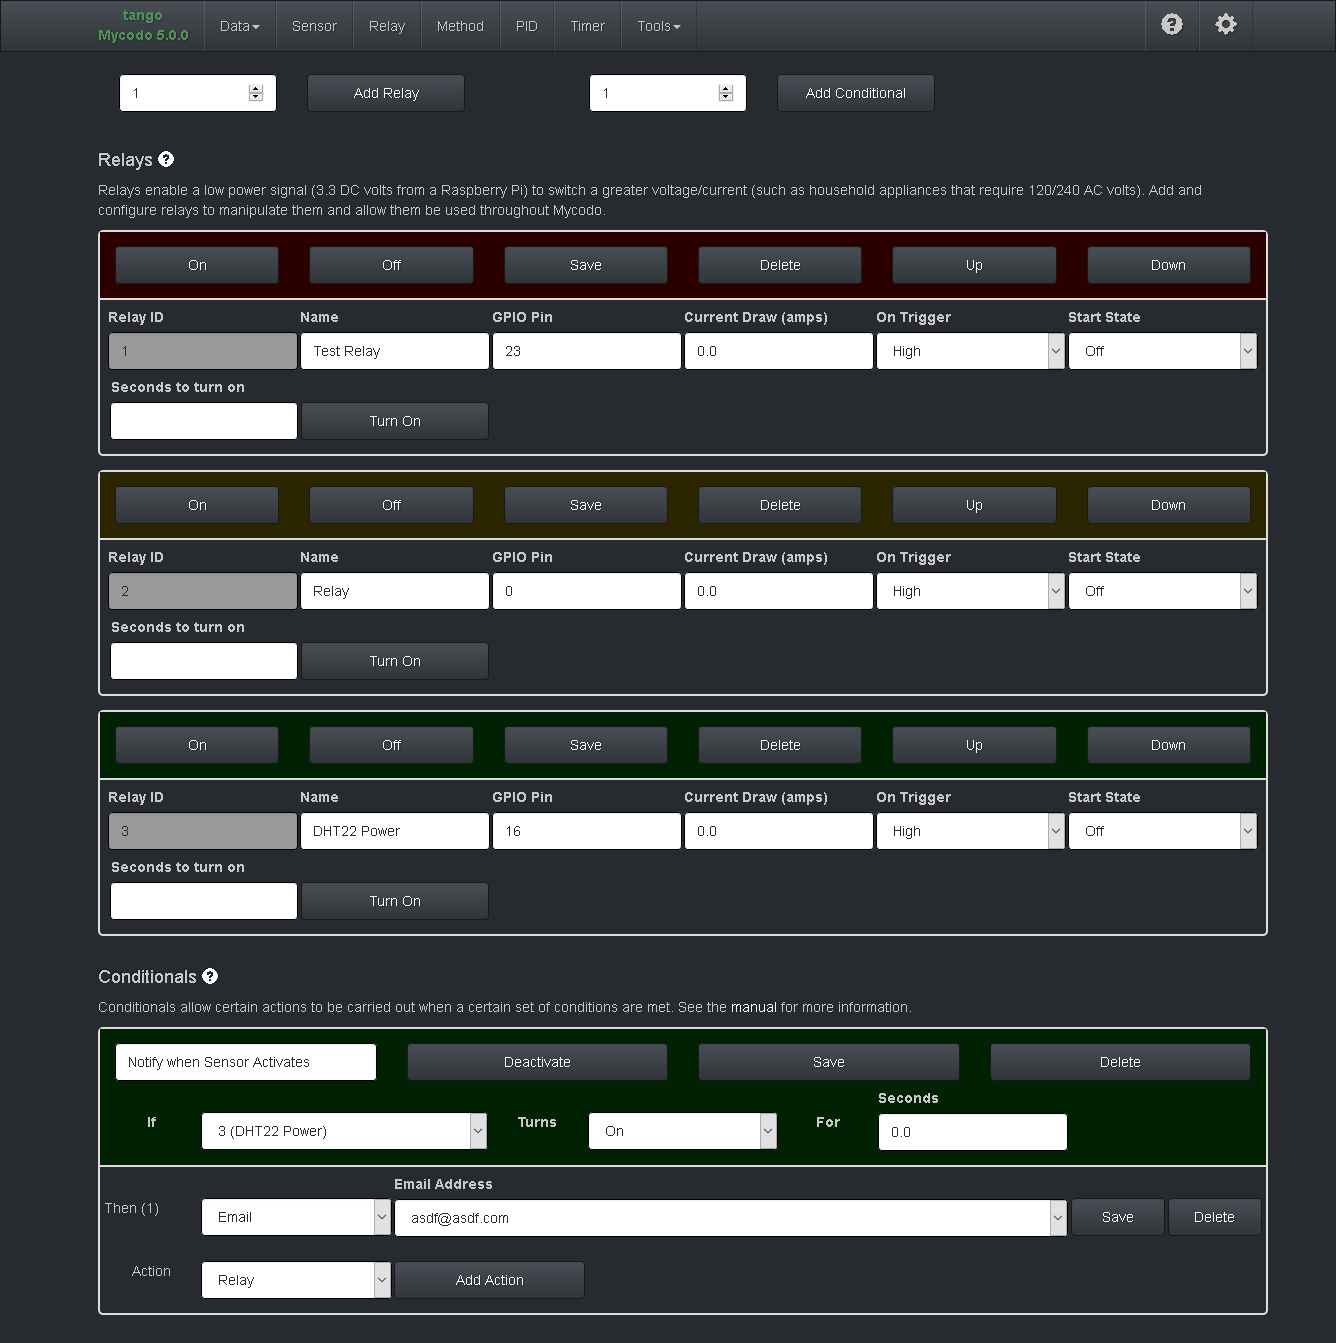
Relays
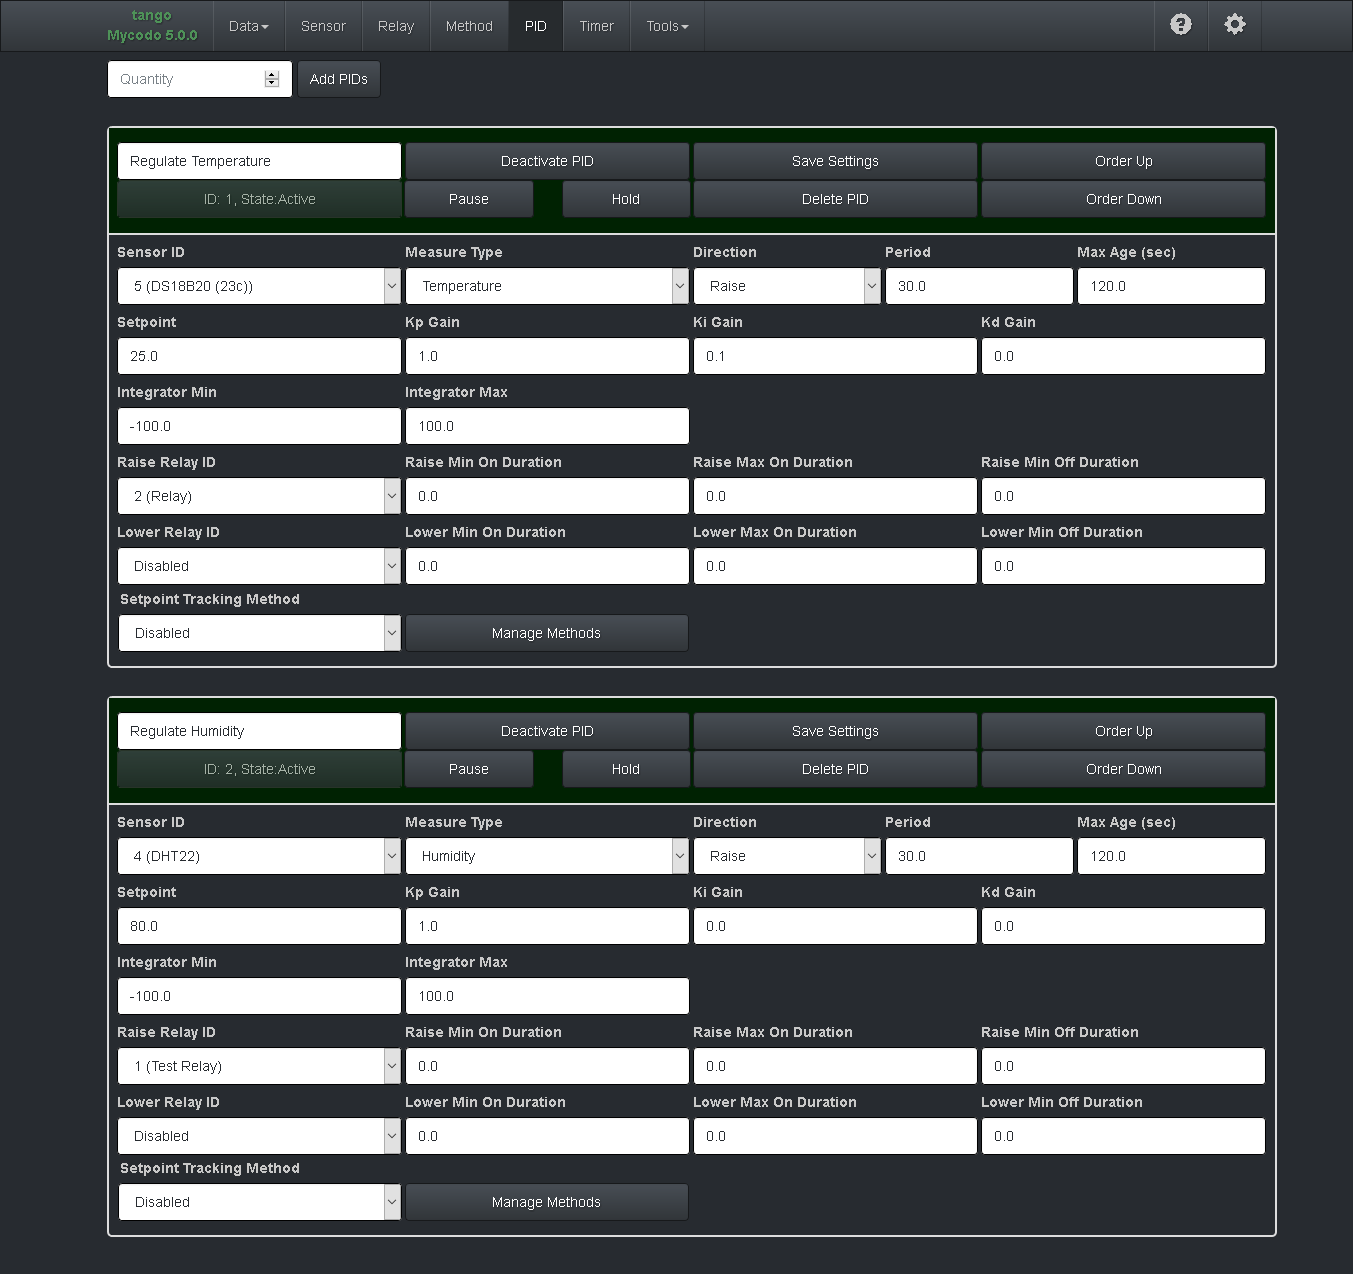
PID Controllers
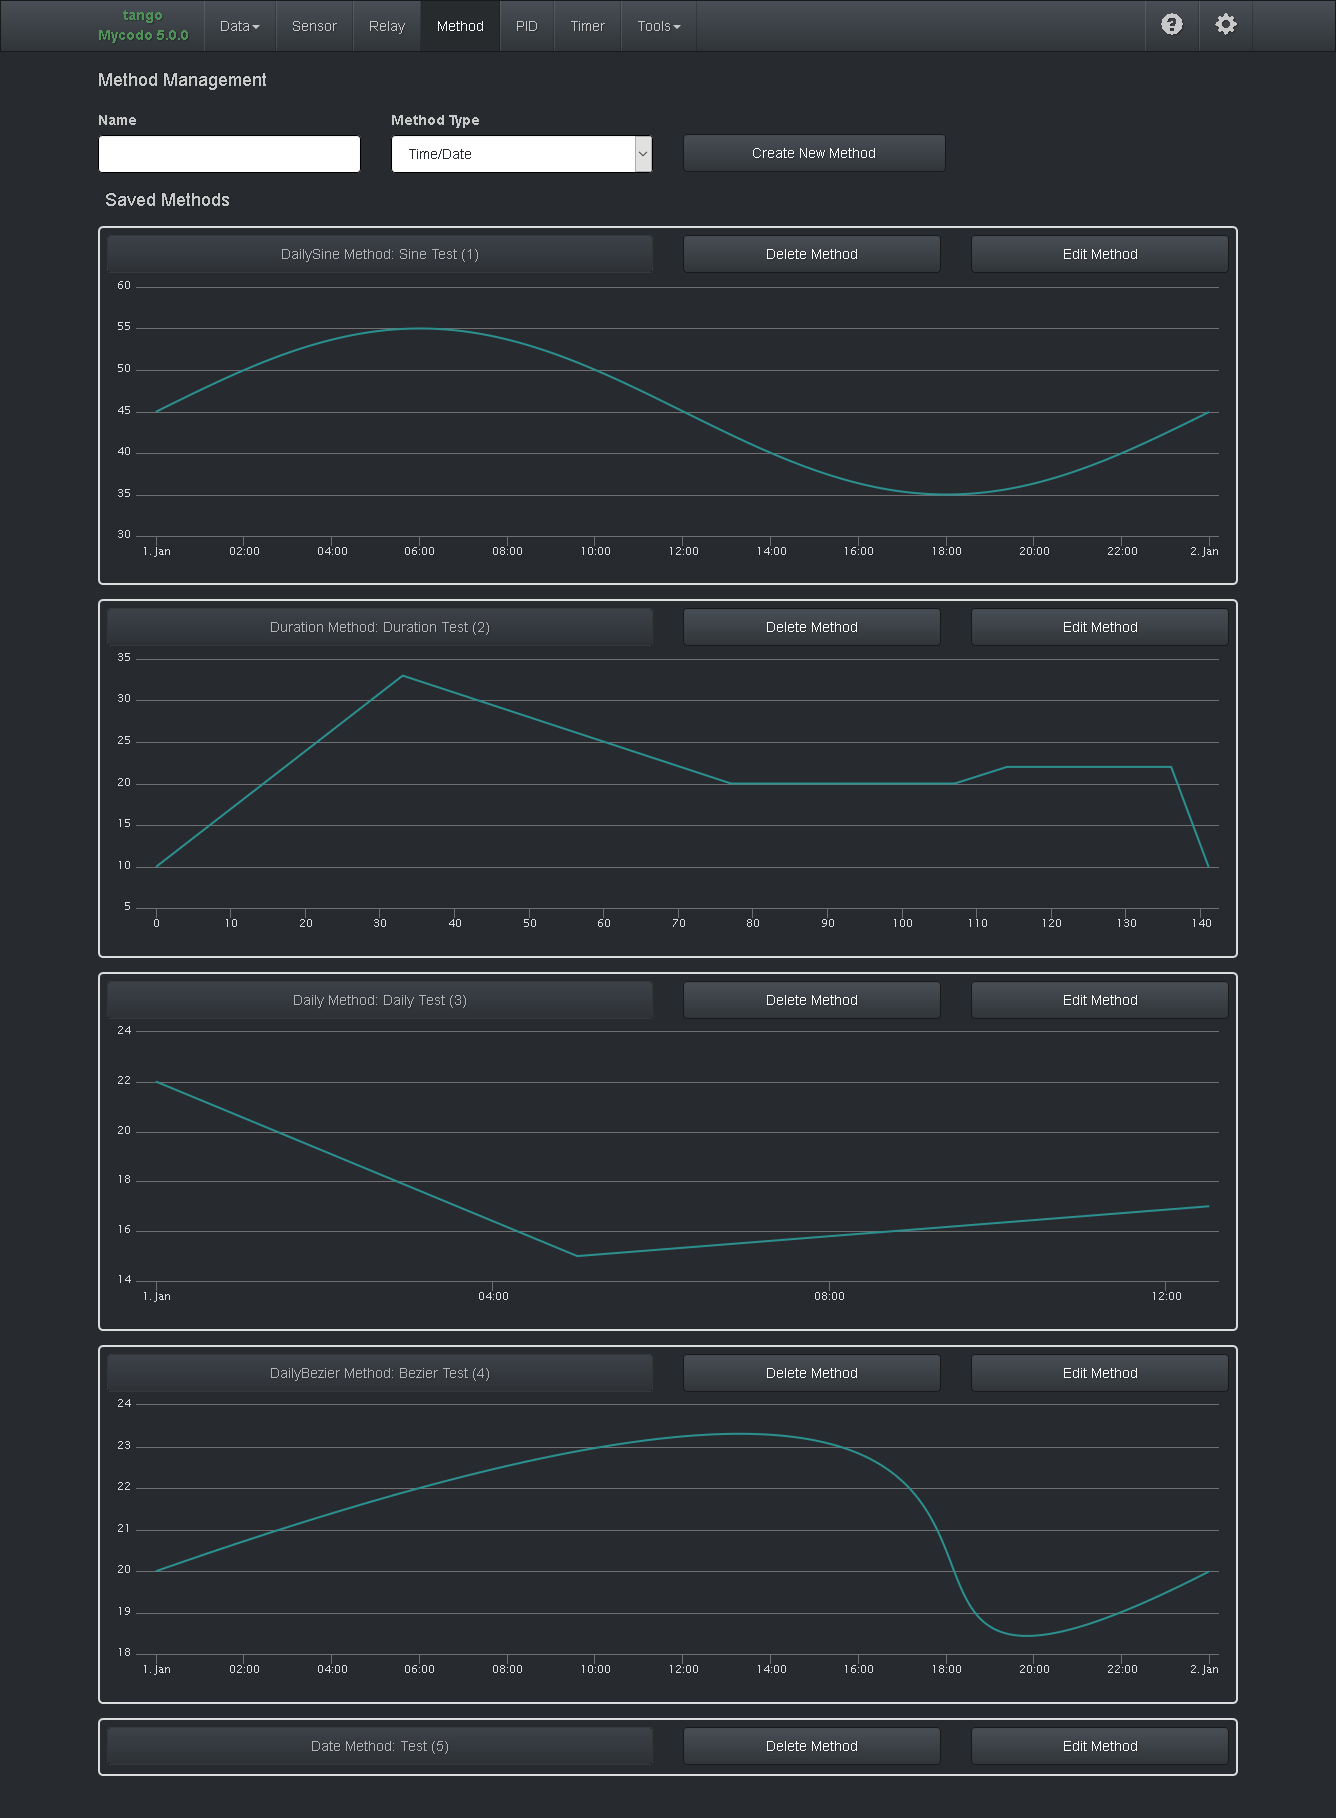
Methods
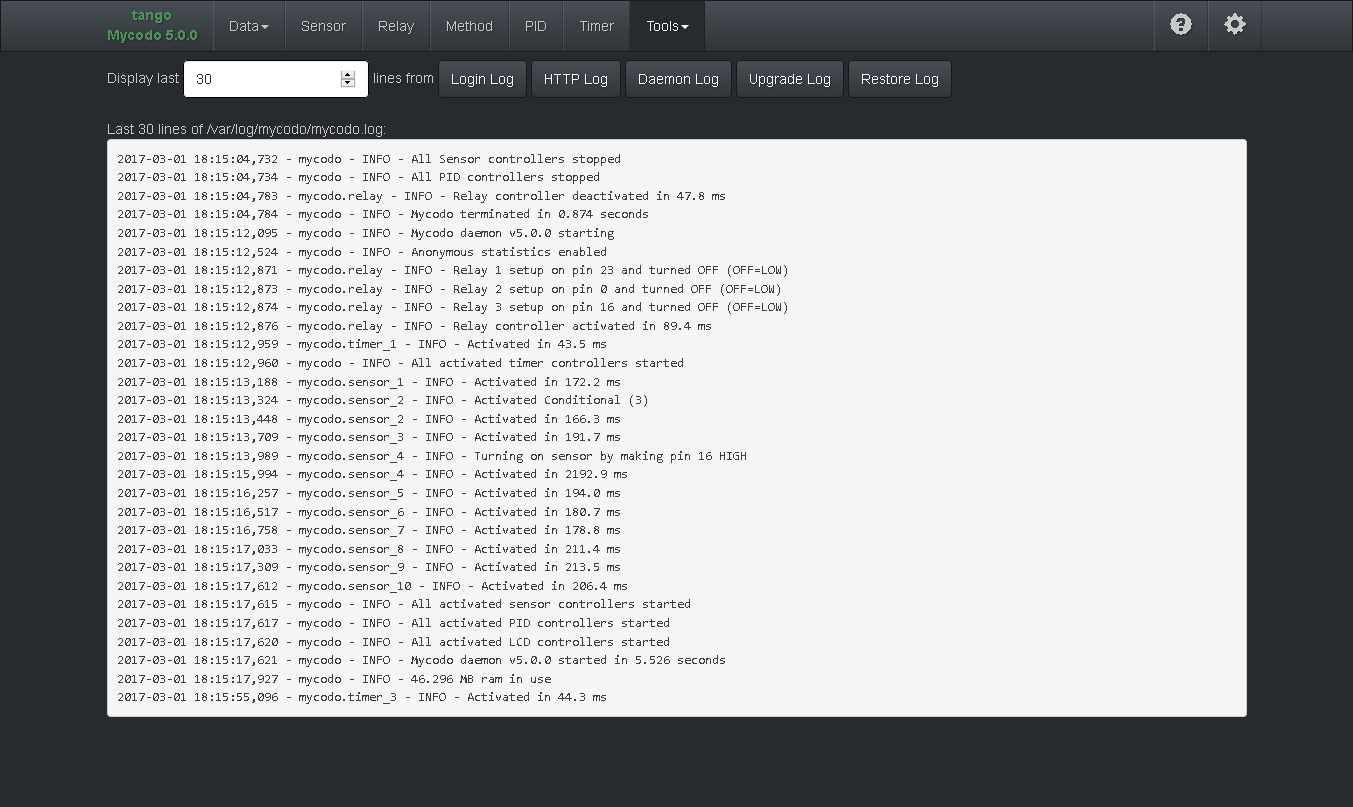
Tools: Log Viewer
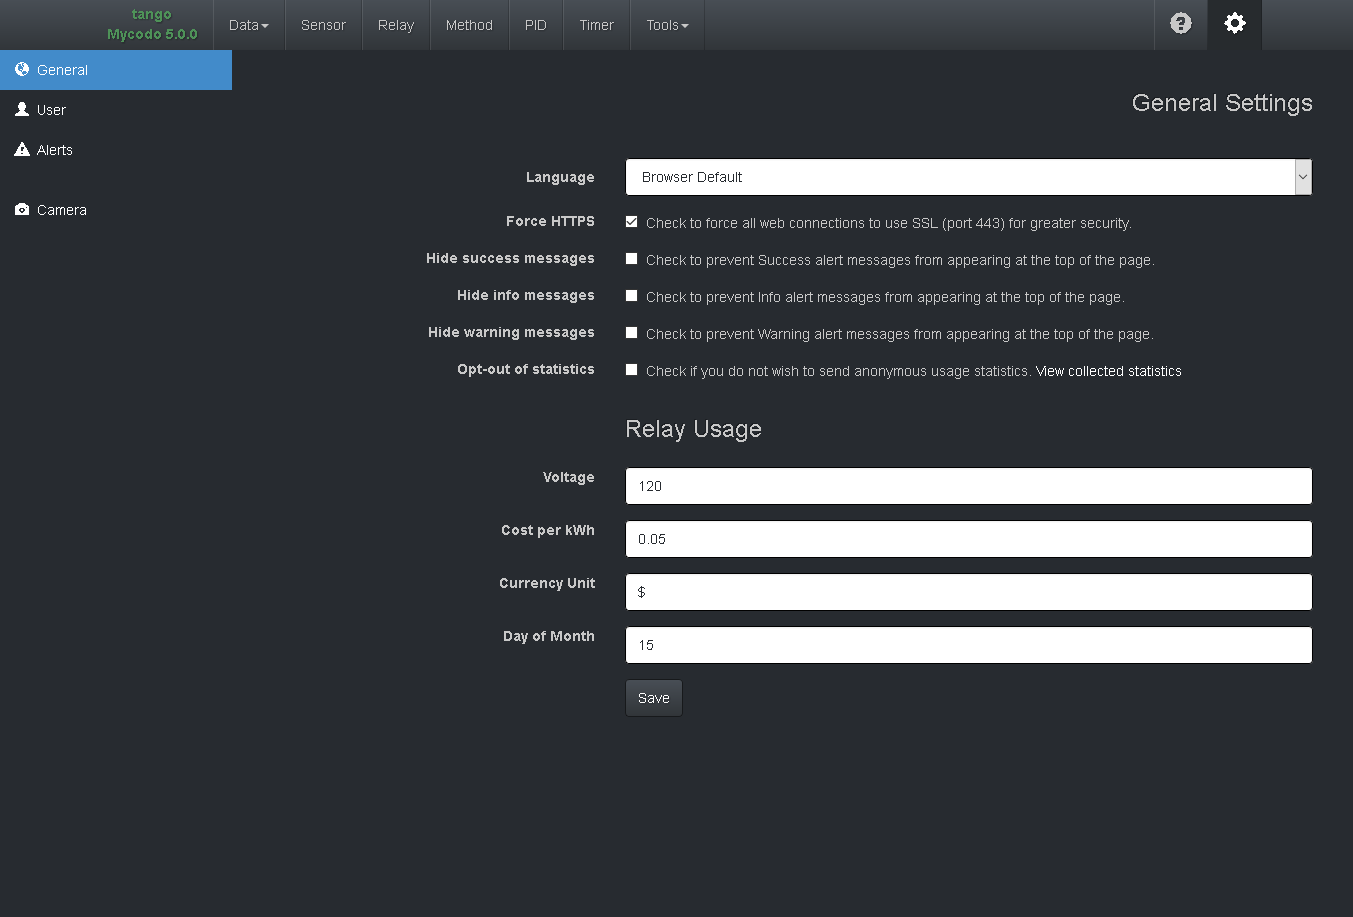
Configuration (General)
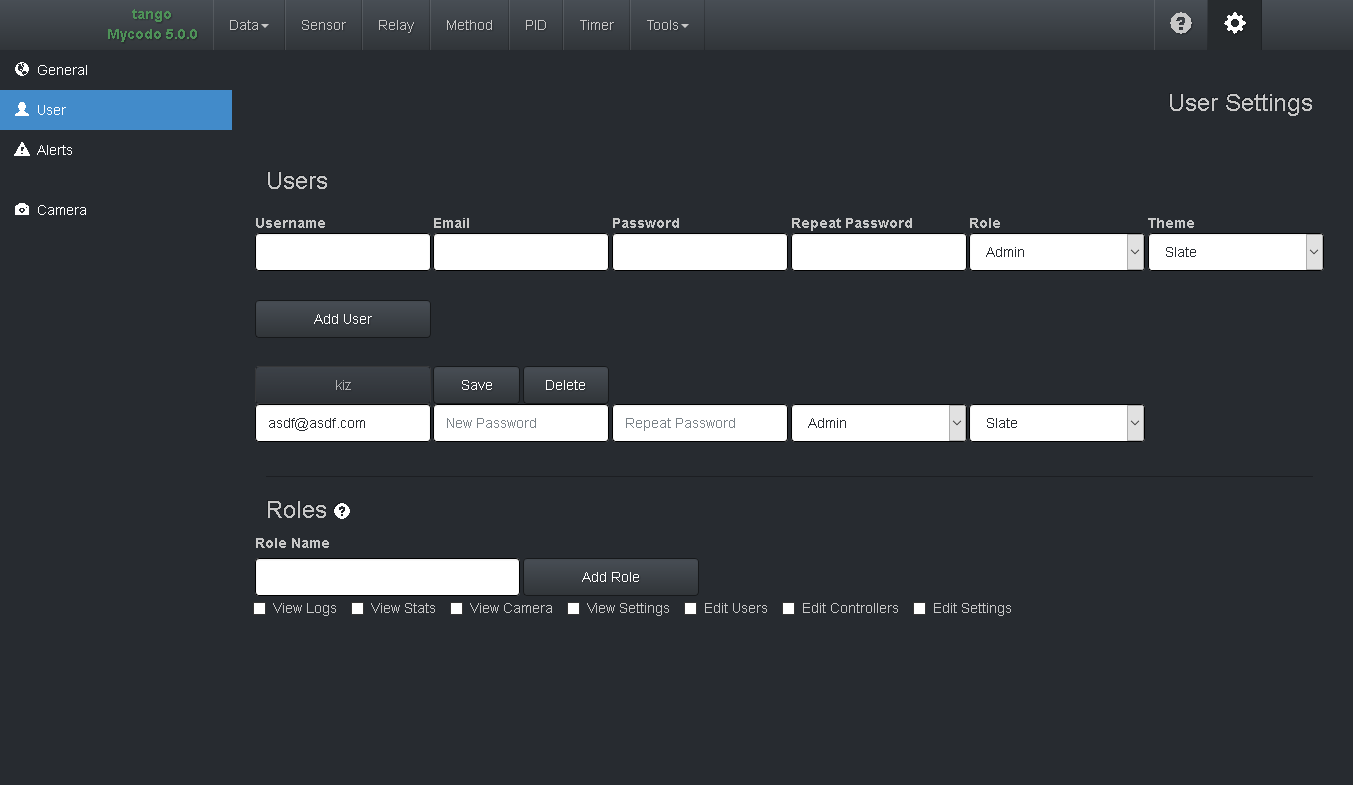
Configuration (Users)
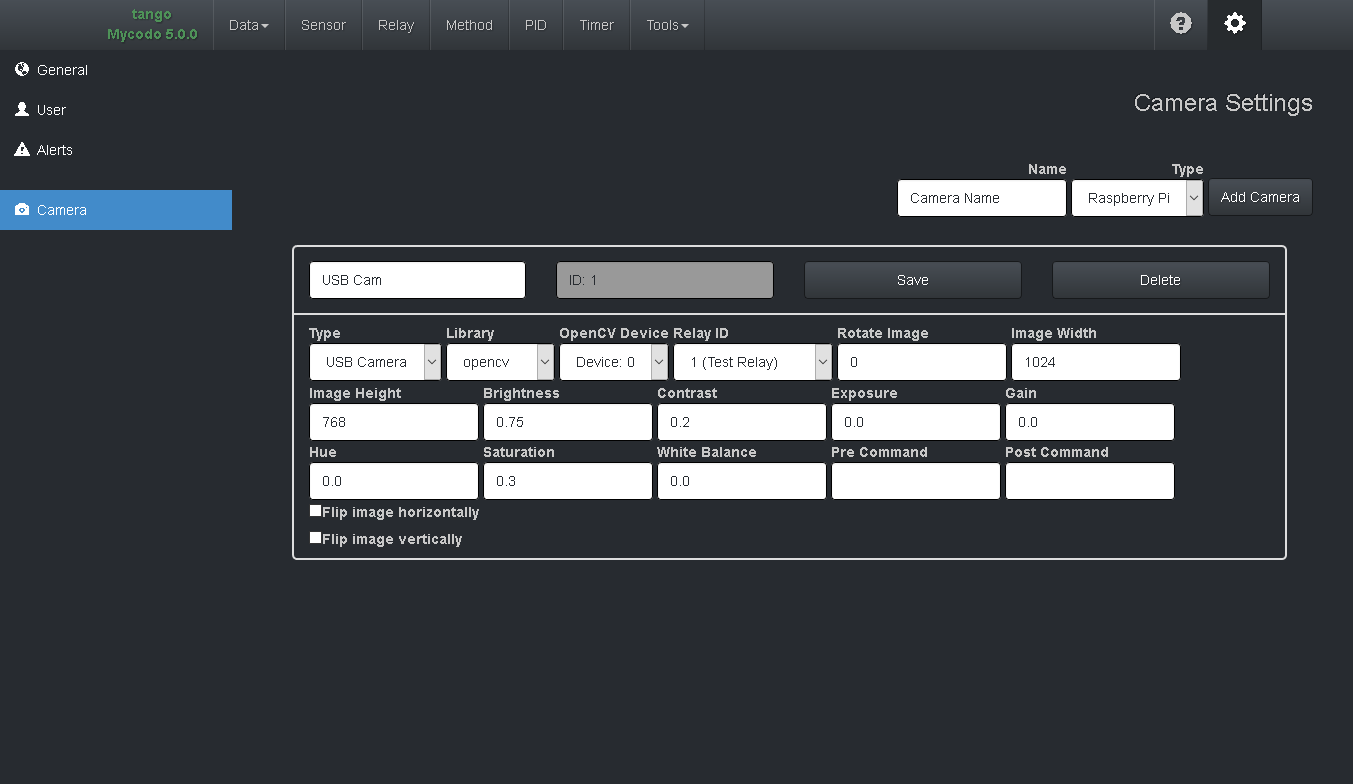
Configuration (Cameras)
Manual