MMVT code is stored in a private repository. If you intend to use it for academic/research purposes, please send us an email from your academic server with your GitHub username, and we will send you an invitation. If you intend to use it for commercial purposes, please contact us for pricing. Email: [email protected].
When you can access the private repo (https://github.com/mmvt/mmvt), run:
- wget https://raw.githubusercontent.com/pelednoam/mmvt/master/download_mmvt.sh (update the script with your github username)
- sh download_mmvt.sh
And continue using the following tutorial: https://github.com/mmvt/mmvt/blob/master/tutorials/installation.md
The manuscript can be found here: https://arxiv.org/abs/1912.10079
Our website: https://mmvt.mgh.harvard.edu/
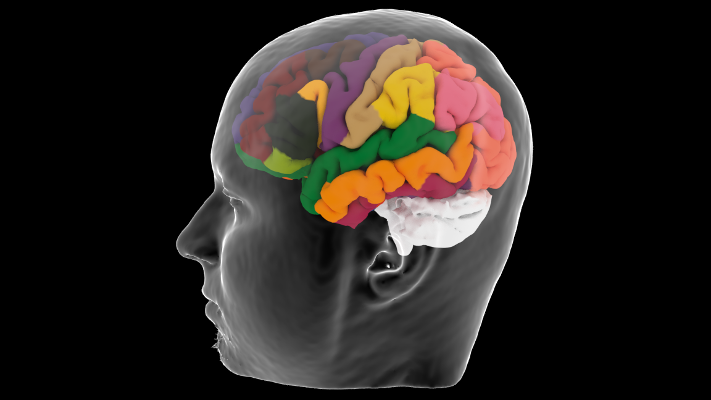
The visualization and exploration of neuroimaging data are important for the analysis of anatomical and functional images and statistical parametric maps. While two-dimensional orthogonal views of neuroimaging data are used to display activity and statistical analysis, real three-dimensional (3D) depictions are helpful for showing the spatial distribution of a functional network, as well as its temporal evolution. For our best knowledge, currently, there is no neuroimaging 3D tool which can visualize both MEG, fMRI and invasive electrodes (ECOG, depth electrodes, DBS, etc.). Here we present the Multi-Modality Visualization Tool (MMVT). The tool was built for researchers who wish to have a better understanding of their neuroimaging anatomical and functional data. The true power of the tool is by visualizing and analyzing data from multi-modalities. MMVT is built as two separated modules: The first is implemented as an add-on in 'Blender”, an open-source 3D visualization software. The add-on is an interactive graphical interface which enables to visualize functional and statistical data (MEG and/or fMRI) on the cortex and subcortical surfaces, invasive electrodes activity and etc. The tool can also be used for a better 3D visualization of the anatomical data and the invasive electrodes locations. The other module is a standalone software, for importing and preprocessing. The users can select the data they want to import to Blender and how they want to process it.
The module supports many types of analyzed data:
- FsFast (FreeSurfer Functional Analysis Stream)
- SPM (Statistical Parametric Mapping)
- MNE (a software package for processing MEG and EEG)
- MEG raw data (fif files)
- FieldTrip (MATLAB software toolbox for neuroimaging analysis)
The users can also reprocess raw data using wrappers for FaFast and MNE-python (a python package for sensor and source-space analysis of MEG and EEG data).
Please visit our new website: mmvt.org
- The aparc.DKTatlas FreeSurfer atlas:

- Short demo how to use the main features (click on the image):
- Resting State fMRI & Cortical labels correlation:

- Spatial and temporal ttest result of MEG activation:

A list of features can be found here
The features can be seen here
Windows full guide
Linux & Mac OS full guide
The tool itself can run on windows, mac and linux. In the preprocessing pipeline there are several calls to FreeSurfer (runs only on linux/mac). Beside of that, you can use the tool also on windows.
Download the template brain Colin27 to learn more about the tool
We've imported colin27 into MMVT, and included data we morphed from a patient. The data includes recording from EEG, MEG, fMRI, and sEEG for the MSIT task. The data can be downloaded from here (1GB). Extract the zip file in the mmvt_blend folder which was created in your mmvt_root folder. Then, open Blender, close the splash screen and open (File->open) colin's blend file (colin27_laus125.blend).
- To learn more about the tool you can find several self-explanatory tasks for Colin27 data here.
- Step by step answers for the tasks can be found here
- Rotate the brain using the middle mouse button.
- Select objects (electrodes / sensors / cortical lables) using the right mouse button. To select cortical labels you need to change first the view to "ROIs" in the Appearence panel.
- Zoom in/out using the mouse scrolling.
The preprocessing tutorial can be found in the wiki sidebar.
Linux: The program can be updated without using the "git pull" function.
- Lunch MMVT.
- Open the "Import objects and data" panel.
- Press the "Update MMVT" button at the top of the panel.
Windows:
- In the Git CMD terminal chage the directory to the mmvt_code folder (example: cd c:\Users\Jhon\mmvt_root\mmvt_code)
- Type: git pull
- Noam Peled ([email protected])
- Ohad Felsenstein ([email protected])
This research was partially funded by the Defense Advanced Research Projects Agency (DARPA) under Cooperative Agreement Number W911NF-14-2-0045 issued by ARO contracting office in support of DARPA's SUBNETS Program. The views, opinions, and/or findings expressed are those of the author and should not be interpreted as representing the official views or policies of the Department of Defense or the U.S. Government. This research was also funded by the NCRR (S10RR014978) and NIH (S10RR031599,R01-NS069696, 5R01-NS060918, U01MH093765).
N. Peled and O.Felsenstein et al. (2017). MMVT - Multi-Modality Visualization Tool. GitHub Repository. https://github.com/pelednoam/mmvt DOI:10.5281/zenodo.438343
MMVT is GNU GPL licenced (v3.0)

