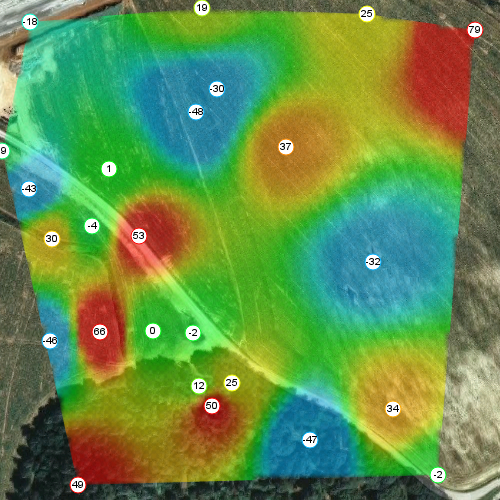
Library to draw temperature maps (heat maps) using Canvas/Javascript. Drawing shows an animation and does not block the main process.
Values are calculated using 'Inverse Distance Weighting (IDW)' algorithm:
https://en.wikipedia.org/wiki/Inverse_distance_weighting
Download this project with:
git clone https://github.com/optimisme/javascript-temperatureMap.git
cd javascript-temperatureMap
Open the example file with a web navigator:
index.html
temperatureMap.js contains the libary source
can0 = document.getElementById("cns0"); // Get the canvas object
ctx0 = can0.getContext("2d");           // Get the canvas context
drw0 = new TemperatureMap(ctx0);        // Create the object

drw0.setRandomPoints(25, width, height);// Assign random points
// Or assign points with drw0.setPoints(arr, width, height);

// To draw the fast map
drw0.drawLow(5, 8, false, function () { // 5 = Number of closer influent points
                                        // 8 = Quality parameter [2, 32]
                                        // false = clean polygon outside
    drw0.drawPoints();                  // Callback function (draw points when done)
});

// To draw the full map with levels
drw0.drawFull(true, function () { /* Do nothing when done */ });

// To draw the full map with gradients
drw0.drawFull(false, function () { /* Do nothing when done */ });Animation showing a random temperature map with:
- Low resolution (fast map)
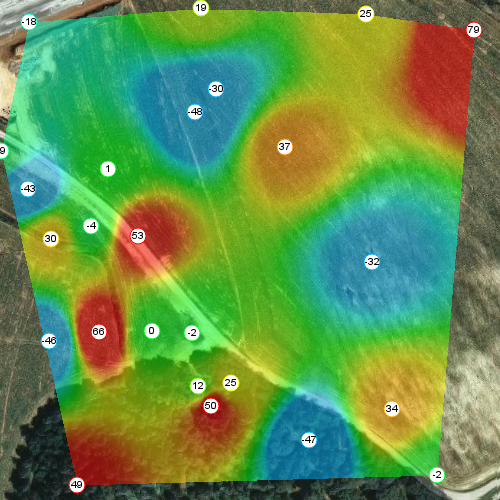
Animation showing a temperature map using previous points:
- Full resolution (slow map)
- Colors by gradients
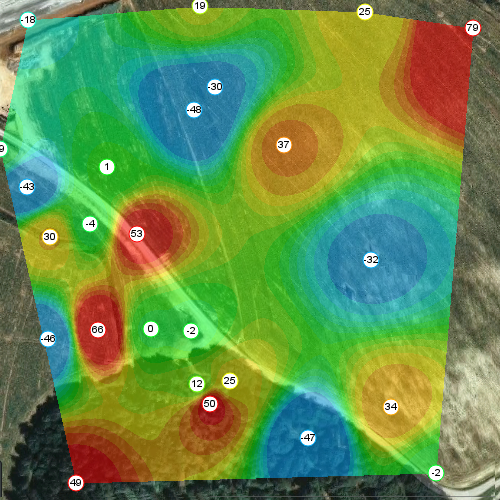
Animation showing a temperature map using previous points:
- Full resolution (slow map)
- Colors by levels


