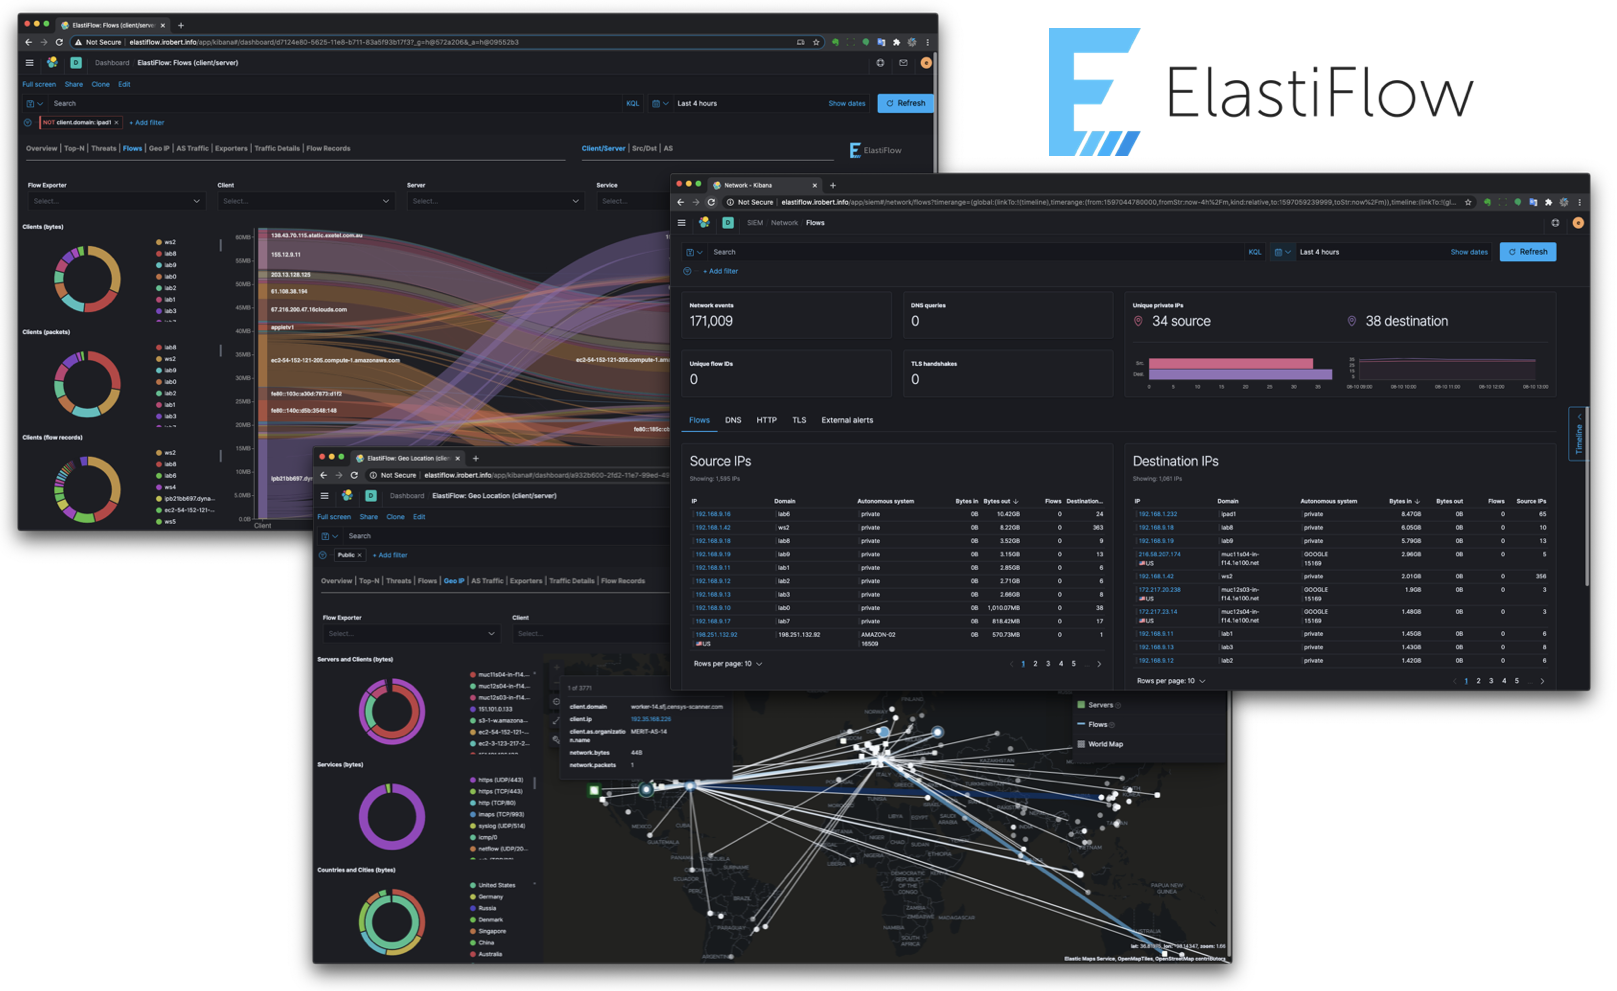
PLEASE NOTE: This repository remains for historical purposes, however no part of this legacy solution is shared with the next generation of ElastiFlow™. To install the new solution please refer to the documentation at docs.elastiflow.com. For assistance with the new solution, please join the ElastiFlow Community Slack.
Now that the new ElastiFlow™ Unified Flow Collector is generally available, the legacy Logstash-based solution in this repository is deprecated. It will remain here for historical purposes, but will not receive updates. You are encouraged to try out the new collector. See more details below.
We have released the next generation of ElastiFlow™ which introduces the new ElastiFlow Unified Flow Collector for Netflow, IPFIX and sFlow.
- Proper management templates from different devices. - NO MORE template conflicts!
- Improved Scalability - Over 10x more flows/sec than Logstash, over 3x more than Filebeat!
- Support for Option Templates - Dynamic enrichment of network interface name and application names and more!
- Telemetry Support - sFlow Counter Samples and other metrics from Cisco, Calix and more!
- Gracefully handles “unknown” Fields - No more dropped flows when a single unsupported field is encountered.
- Fully decodes and translates all available data - DSCP, TCP Options, ECN, Fragmentation Flags, and more.
Get Started with the next generation of ElastiFlow... HERE
You can also join the ElastiFlow community Slack... HERE
ElastiFlow™ provides network flow data collection and visualization using the Elastic Stack (Elasticsearch, Logstash and Kibana). It supports Netflow v5/v9, sFlow and IPFIX flow types (1.x versions support only Netflow v5/v9).
I was inspired to create ElastiFlow™ following the overwhelmingly positive feedback received to an article I posted on Linkedin... WTFlow?! Are you really still paying for commercial solutions to collect and analyze network flow data?
NOTE - Please refer to
INSTALL.mdfor installation instructions.
ElastiFlow™ is built using the Elastic Stack, including Elasticsearch, Logstash and Kibana. Please refer to INSTALL.md for instructions on how to install and configure ElastiFlow™.
If you are new to the Elastic Stack, this video goes beyond a simple default installation of Elasticsearch and Kibana. It discusses real-world best practices for hardware sizing and configuration, providing production-level performance and reliability.
Additionally local SSD storage should be considered as mandatory! For an in-depth look at how different storage options compare, and in particular how bad HDD-based storage is for Elasticsearch (even in multi-drive RAID0 configurations) you should watch this video...
NOTE: Please make sure that have reviewed KNOWN_ISSUES.md prior to getting started.
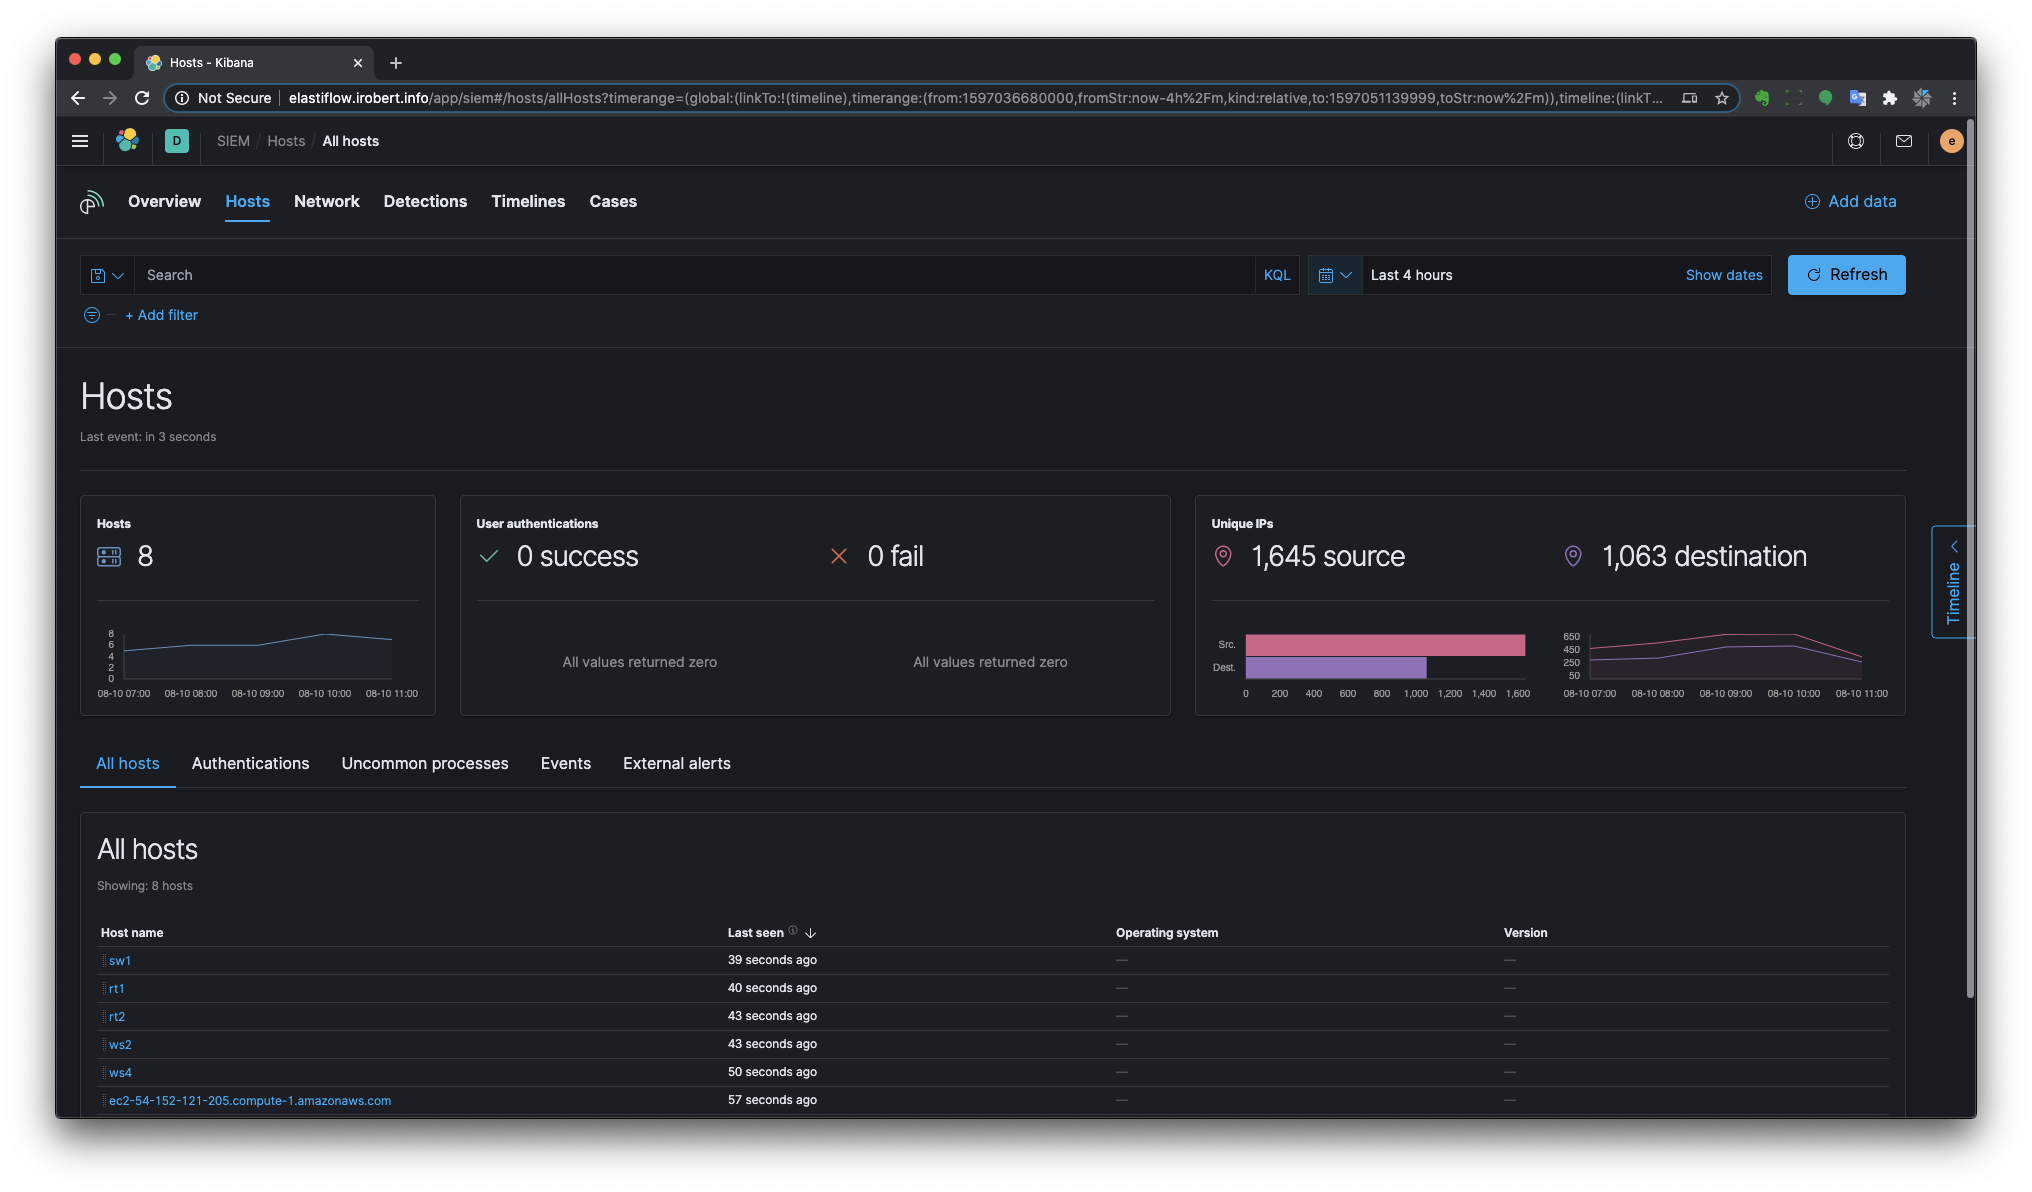
The following dashboards are provided.
NOTE: The dashboards are optimized for a monitor resolution of 1920x1080.
There are separate Top-N dashboards for Top Talkers, Services, Conversations and Applications.
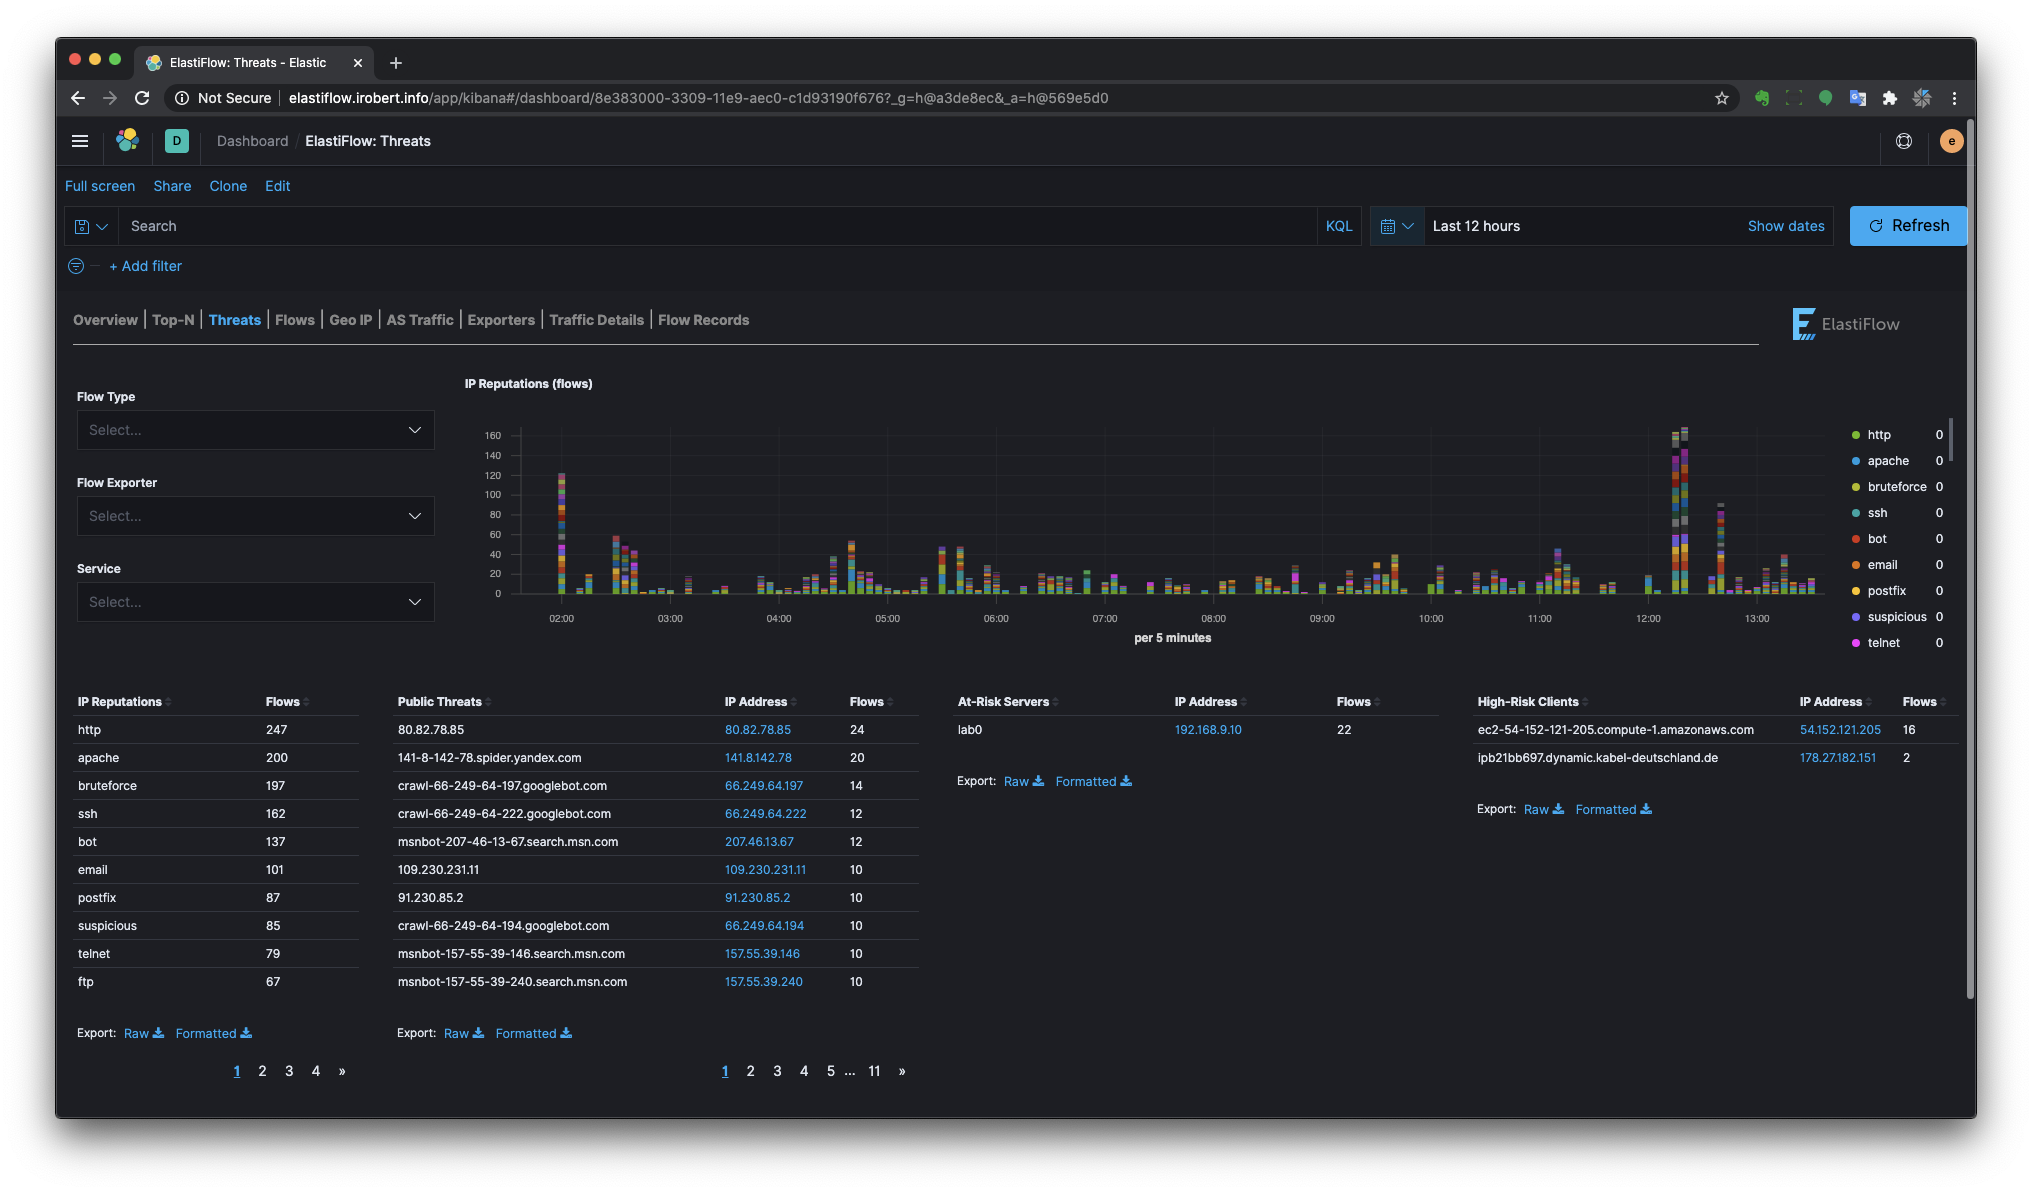
ElastiFlow™ includes a dictionary of public IP addresses that are known to have a poor reputation. This dictionary is built from many OSINT data sources, normalized to a common taxonomy. The Threats dashboard uses this IP reputation information to highlight three threat/risk types.
- Public Threats - Public clients with a poor IP reputation that are reaching private addresses.
- At-Risk Servers - Private Servers that are being reached by clients with a poor IP reputation.
- High-Risk Clients - Private clients that are accessing public servers which have a poor reputation.
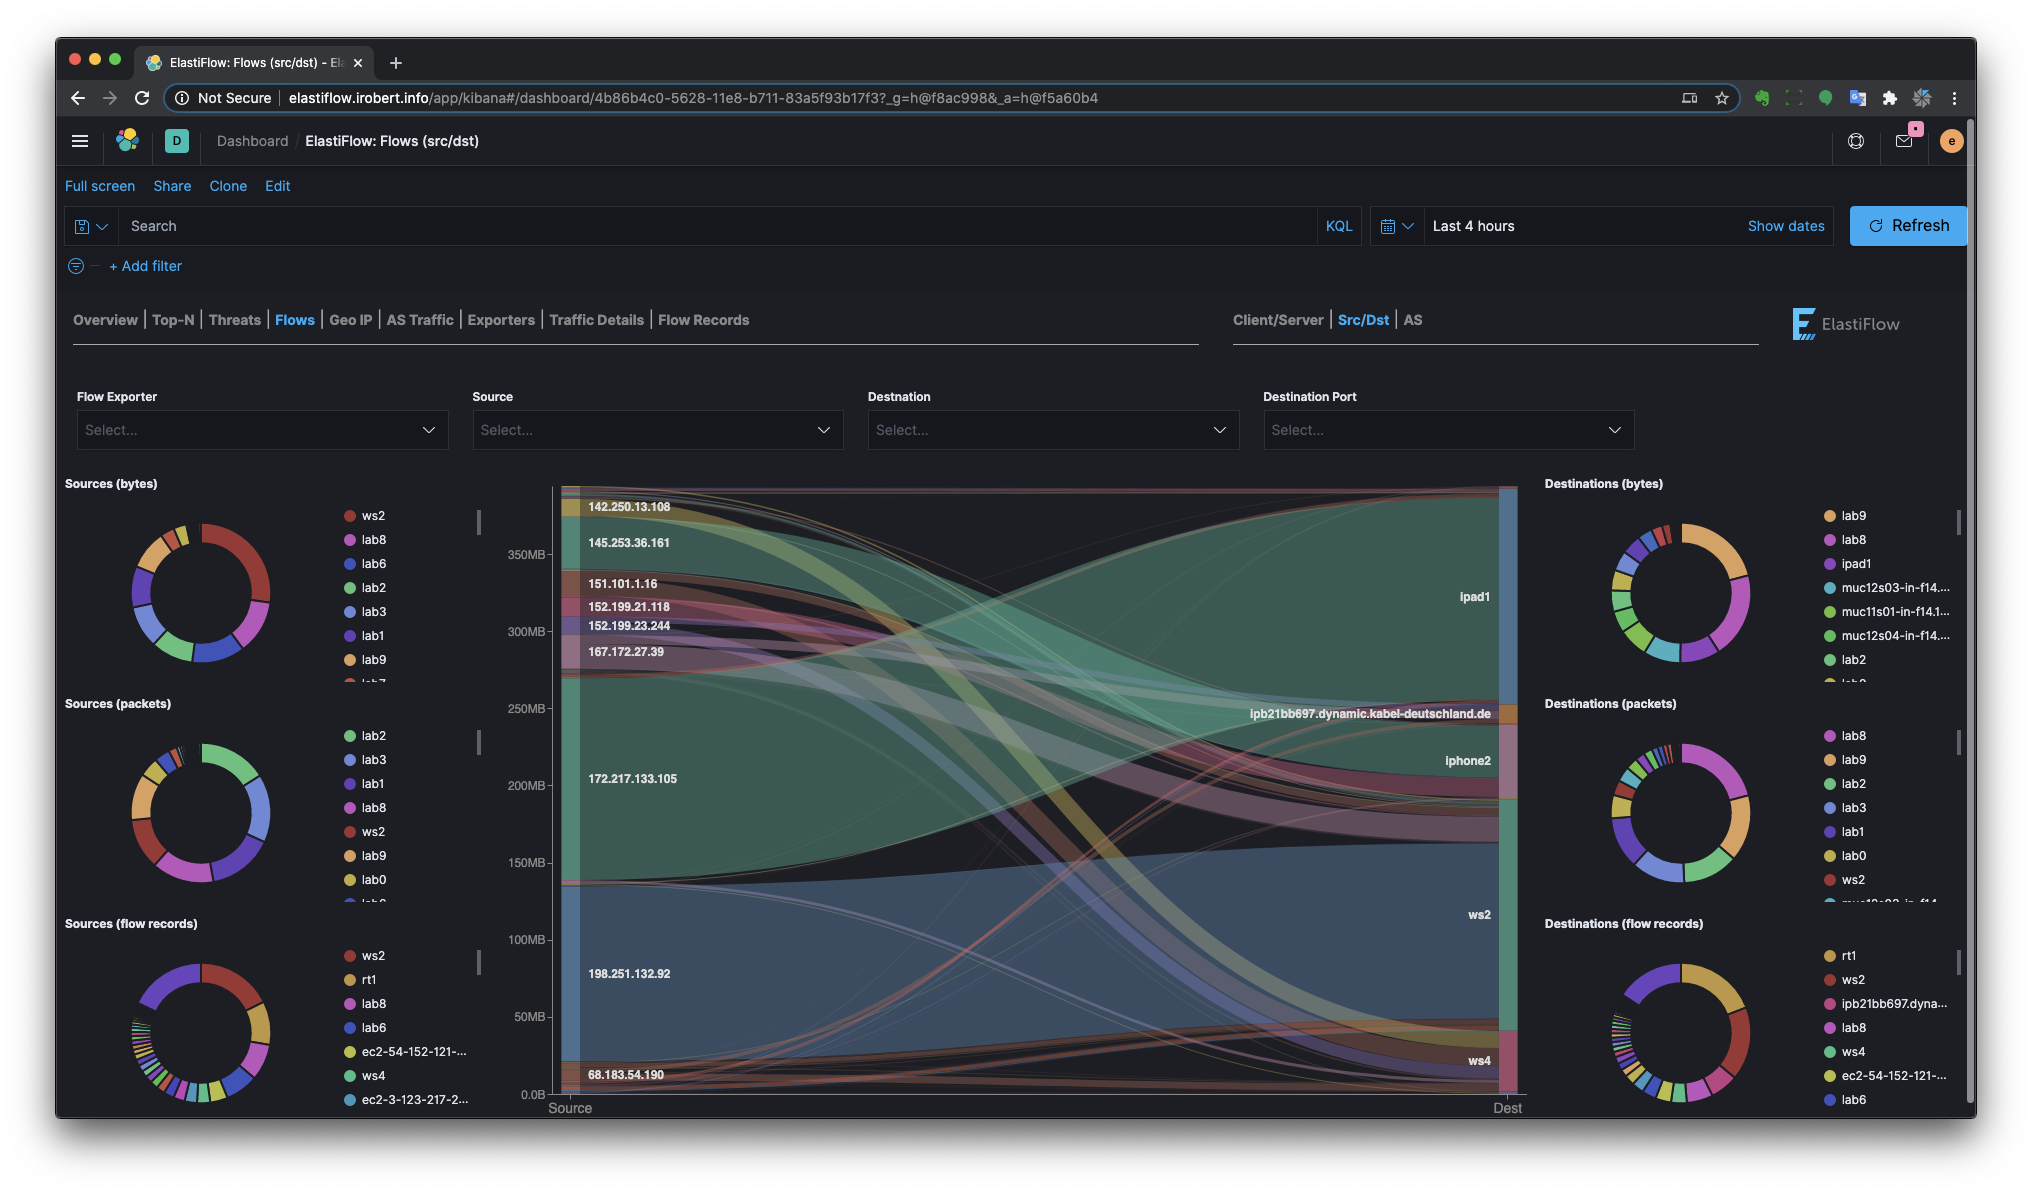
There are separate Sankey dashboards for Client/Server, Source/Destination and Autonomous System perspectives. The sankey visualizations are built using the new Vega visualization plugin.
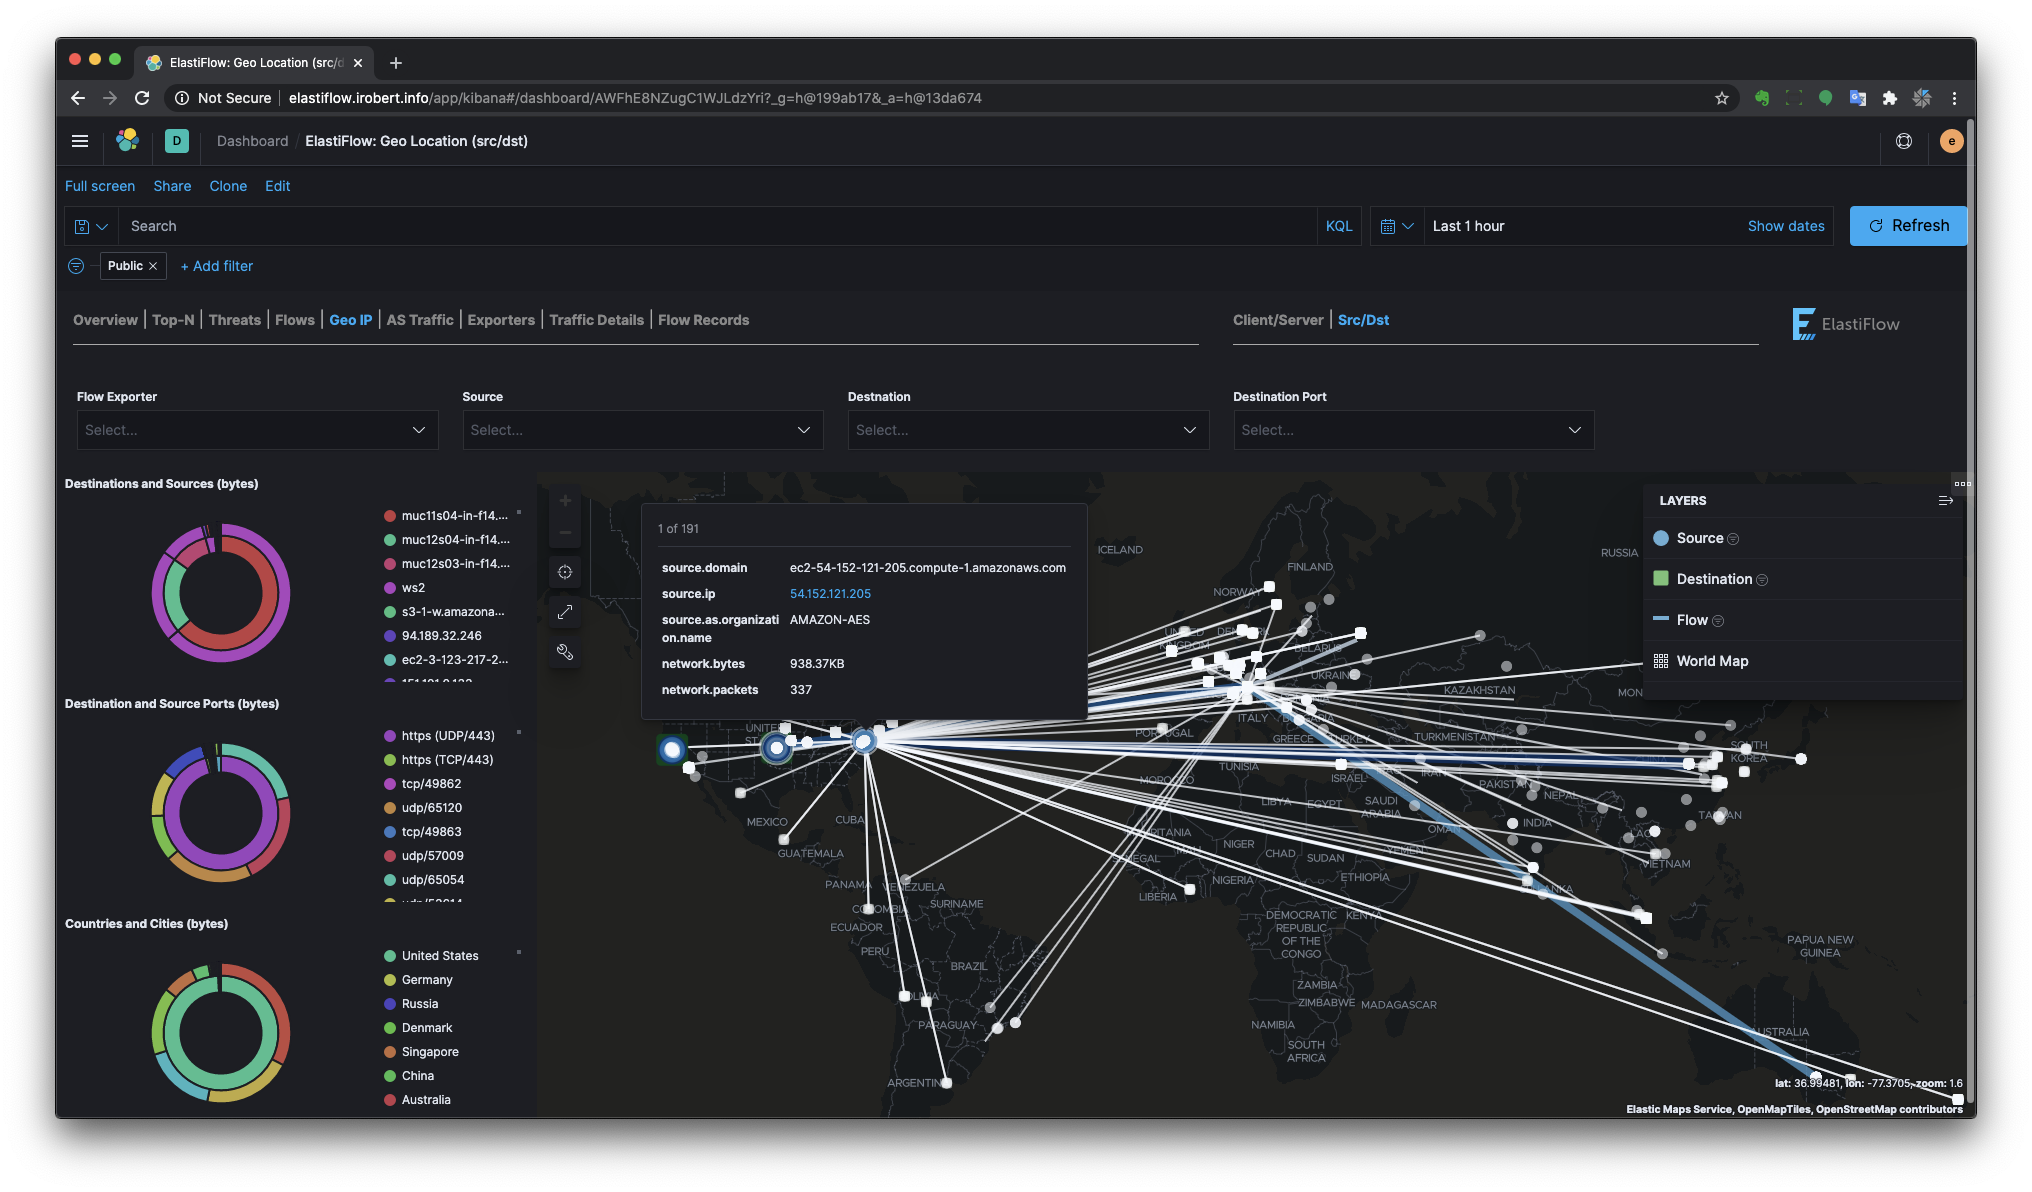
There are separate Geo Location dashboards for Client/Server and Source/Destination perspectives.
Provides a view of traffic to and from Autonomous Systems (public IP ranges)
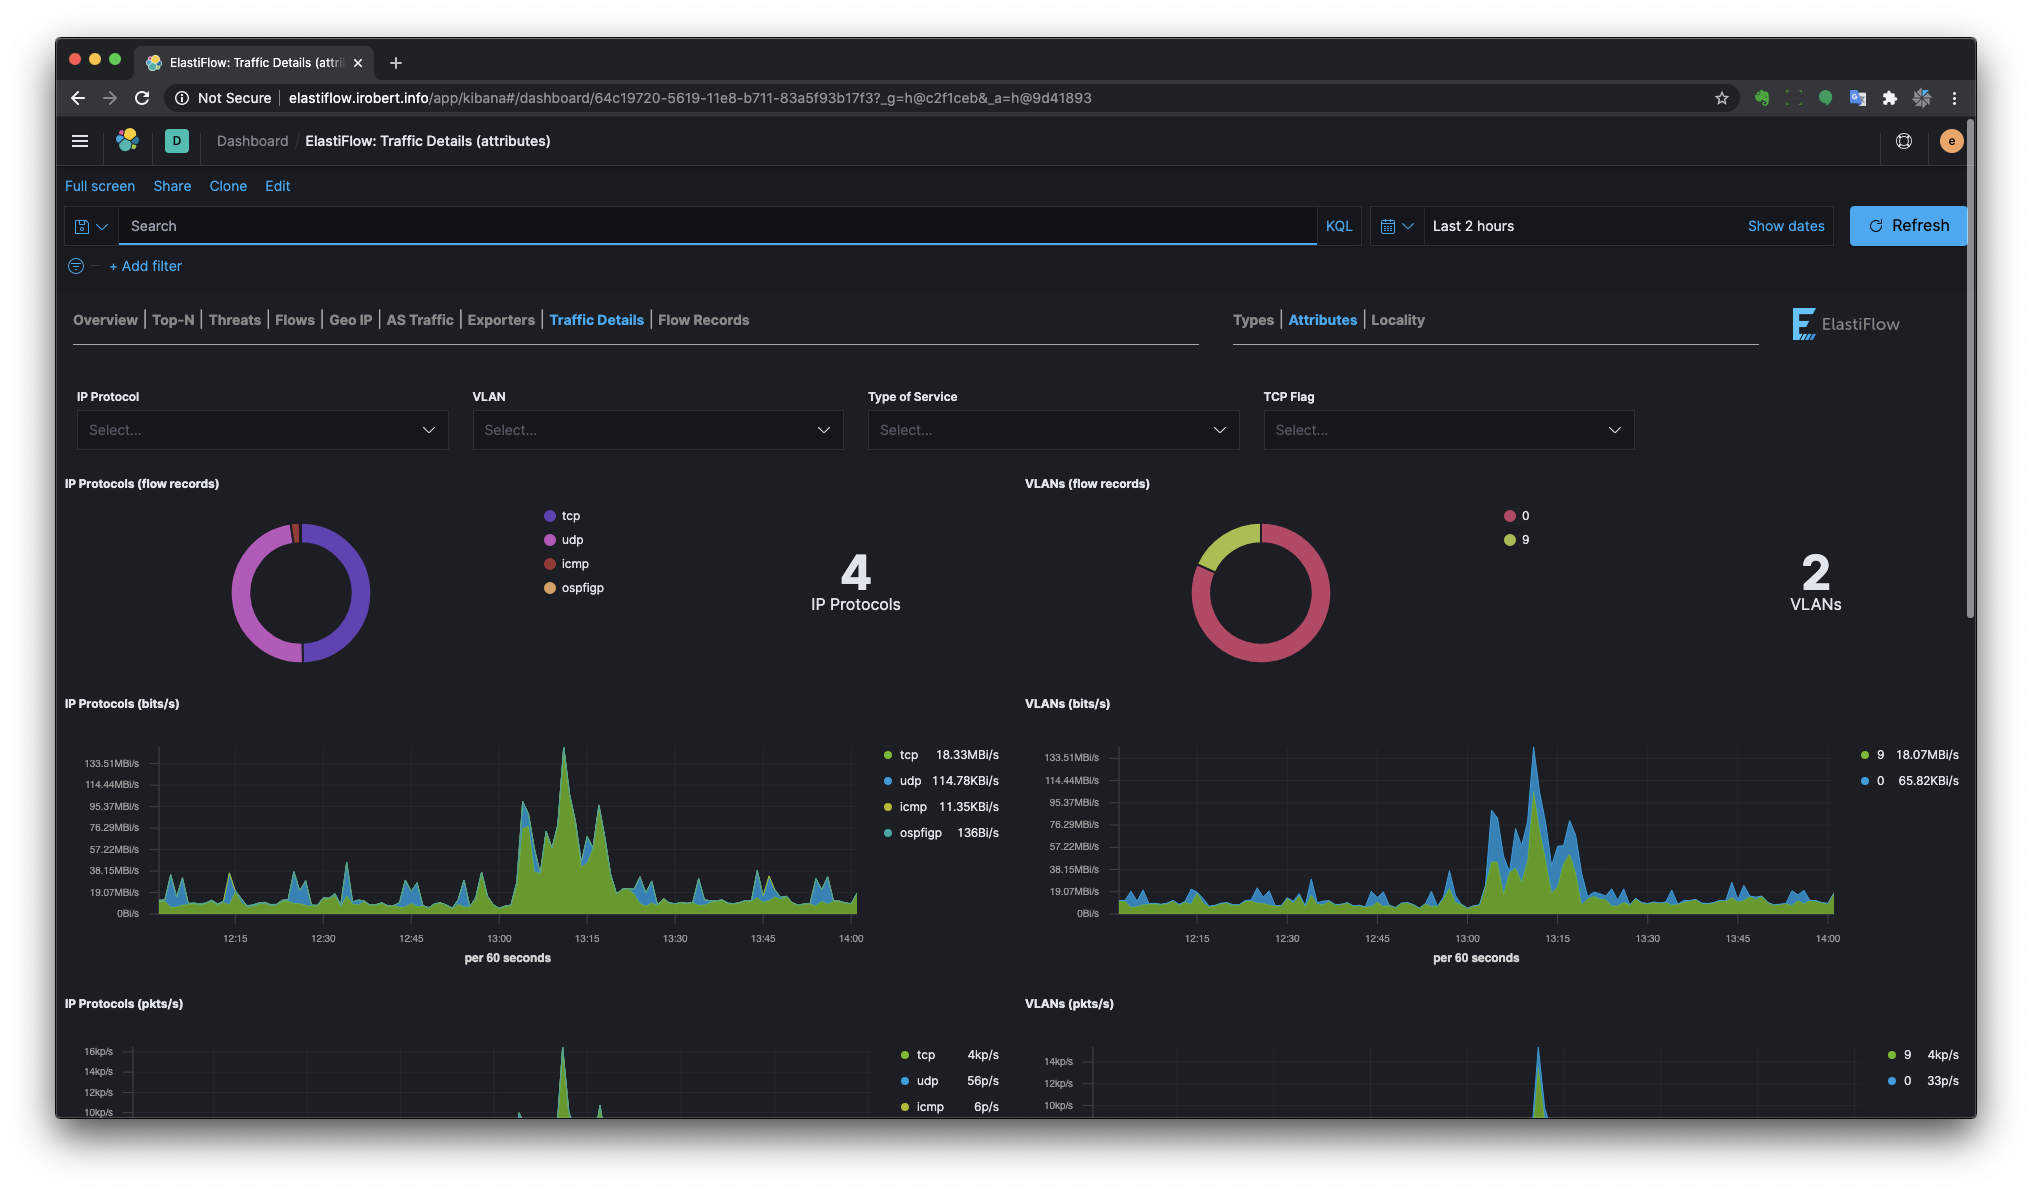
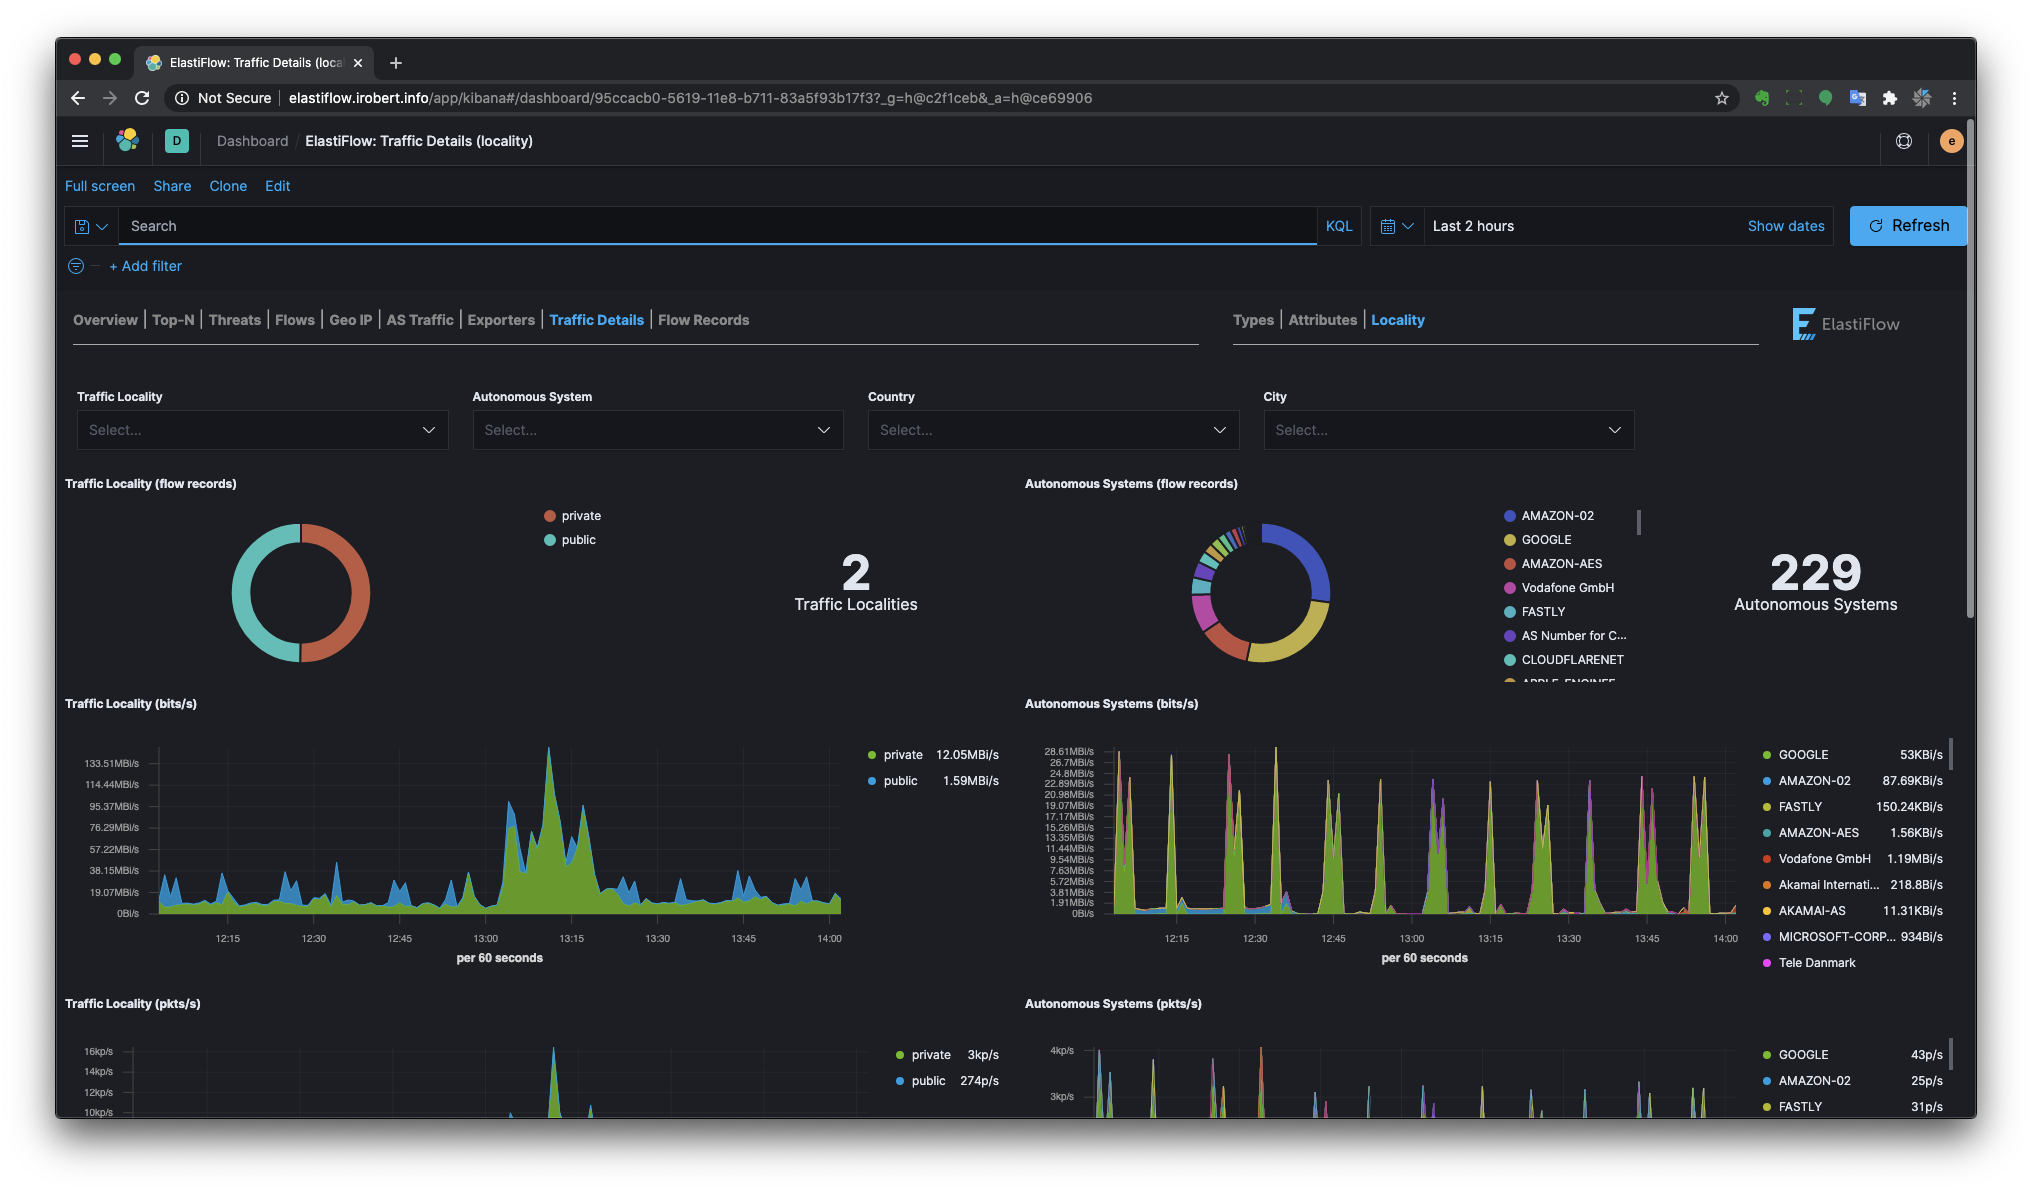
Provides more detailed breakdown of various network traffic characteristics.
ElastiFlow™ v3.4.0 added support for IPFIX records from Ziften's ZFlow agent. In addition to being fully integrated with the standard dashboards, a stand-alone ZFlow dashboards displays network traffic based on user and command data provided by ZFlow.

This product includes GeoLite2 data created by MaxMind, available from (http://www.maxmind.com)
