-
Notifications
You must be signed in to change notification settings - Fork 29
CARNIVAL outputs
The results from the runCARNIVAL function i.e. the optimised network descriptions can be saved as a variable as they together with figures will be saved in the result folder. In case multiple solutions were found, individual model structures and nodes activities will be written to the file "interactions_(i)_ model(j).tsv" and "nodesActivity_(i)_ model(j).txt", respectively, where (i) refers to the experimental condition and (j) refers to the numbering of solutions.
The aggregation of the results from multiple solutions (as well as from a single solution) are exported as into the file "weightedModel_(i).txt" and "nodeAttributes_(i).txt" for network structure and nodes' attributes, respectively. The exported DOT figure combines the results from multiple (and single) solutions can be open with e.g. GraphViz and the results are also stored as an RData file for further analyses together with a log file.

The file contains 4 columns: "Node1", "Sign", "Node2", and "Weight", and each line contains each interaction which is present in at least one of the pool of network solution(s). "Node1" refers to the source node of the interaction. "Node2" refers to the target node of the interaction. "Sign" refers to the type of interactions where 1 is activation and -1 is inhibition. "Weight" represents the percentage of respective interaction in the pool of network solution(s).
Note that the interactions with lower weights could be pruned out to obtain a consensus network. Nevertheless, the interactions with low weights generally represent alternative solutions which could have additional values for alternative pathways analyses.

This file contains 6 columns: "Node", "ZeroAct", "UpAct", "DownAct", AvgAct", and "nodesP". "Node" refers to the node's name. "ZeroAct" refers to the percentage of node to have zero activity (i.e. not included in the network solution). "UpAct" refers to the percentage of node to have positive [1] activity. "DownAct" refers to the percentage of node to have negative [-1] activity. "AvgAct" refers to differences between "UpAct" and "DownAct" (i.e. AvgAct = UpAct - DownAct). "nodeP" contains the Tag for different types of node: 'P' refers to measured node while 'D' refers to the perturbator e.g. Drug. All nodes in the PKN are represented in this file.
Note that the "AvgAct" value in this file could represent the mean activity of the node in the combined network. However, it would also be highly biased once the number of network solutions is low. Also "AvgAct" equals to zero might not always signify that the node activities are not changing but could come from the equal activities between positive and negative as well.

The file contains 3 columns: "Node1", "Sign", and "Node2", and each line contains each interaction which is present in the individual network solution. "Node1" refers to the source node of the interaction. "Node2" refers to the target node of the interaction. "Sign" refers to the type of interactions where 1 is activation and -1 is inhibition.

This file contains 2 columns: "Nodes" and "Activity". "Nodes" refers to the node name and "Activity" refers to the predicted state of the individual solution network.

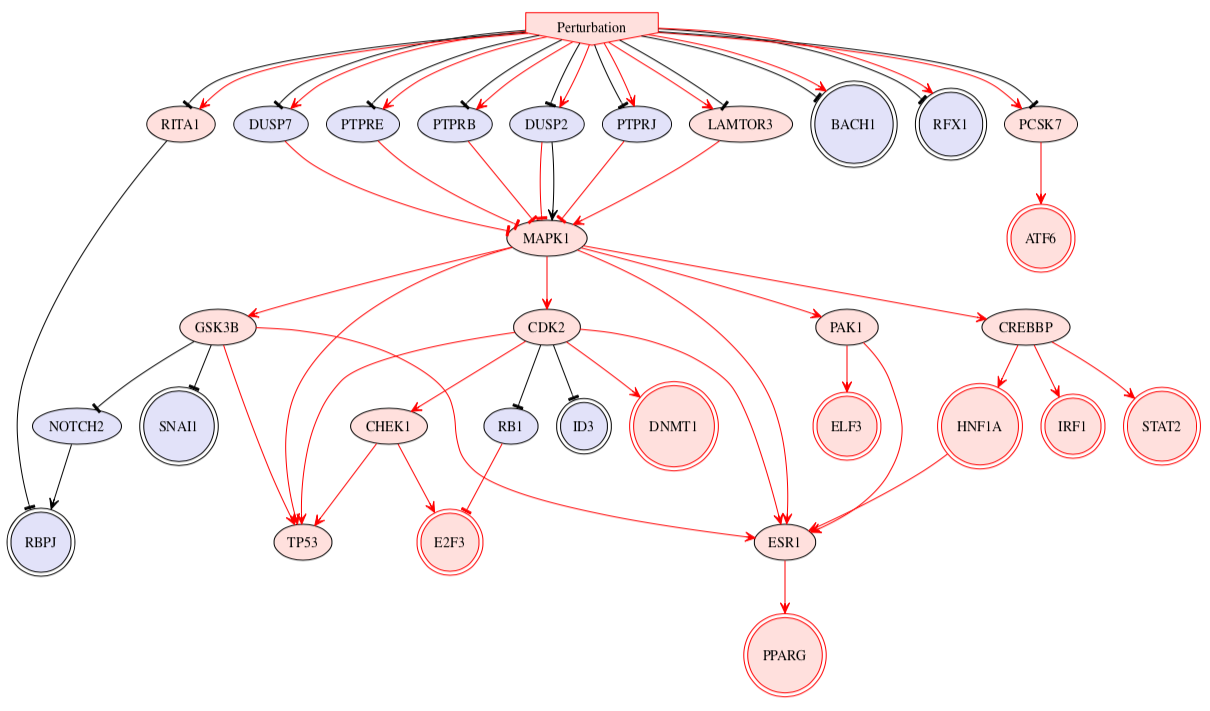
To quickly obtain an overview of network solution(s), the network description of the combined solution networks are coded in the DOT file format which can readily be visualised on DOT graphic reader e.g. GraphViz. The description of the nodes and edges in the DOT figures are as follows:
- Inverted pentagonal (house) shape: Input of the network
- Doubled circle shape: Measurement in the network
- (Single) circle shape: Inferred node which connects between input and measurement nodes
- Colours: Blue = up-regulated (AvgAct > 0); Red = down-regulated (AvgAct < 0); Grey = neutral (AvgAct = 0)
- Pointed arrow: activatory interaction according to PKN
- Barred arrow: inhibitory interaction according to PKN
- Colours: Black = convey activatory signal (AvgAct * Sign > 0); Red = convey inhibitory signal (AvgAct * Sign < 0)
Note that there might also be some inconsistencies of colours for nodes and edges in this overview of network solution(s) as this figure came from the aggregated information from multiple solutions. Please refer to the individual solutions to check for consistency of solution in the respective case.
Apart from these key result files, several additional files are also exported by default as follows:
- cplex_(i)_ (j).log: exported log file from R console - useful to track the evolution of solutions during the optimisation.
- results_CARNIVAL.Rdata: contains a list of exported results as an R-object which can be further used for post-processing.
- elapsed_time.txt: recorded time for each step of the CARNIVAL pipeline including writing constraints, optimisation, and writing result files.