The K-Medoids model for Music Recommendation was introduced in the paper “Music Recommendation using Different Clustering Models”.
For our experiment, the Model was trained on 610 instances which are songs taken from a Spotify playlist. The model’s goal is to suggest five or more songs that align with a user’s musical preferences.
- Authors: Rinaldi Ivan, de Benedictis Salvatore, Sibilla Antonio, Laraspata Lucrezia
- Model date: 08/07/2023
- Model version: v1.0
- Model type: Music Recommendation using the K-Medoids Clustering Model
- Useful papers: Music Recommendation using Different Clustering Models
- License: MIT License
K-medoids, also known as Partitioning Around Medoids (PAM), is one of the most widely used clustering algorithms. It is a variation of K-means that uses actual data points as cluster representatives or medoids. With respect to the K-Means, it is robust to outliers and works well with non-Euclidean distance metrics.
By utilizing playlists available on Spotify, song clusters are created using the K-Medoids clustering model. For our experiment, we used the playlist «keep grinding.» as the training set, and the playlist «Spotify Most Played All Time 500Mil+» as the test set.
More information about the data used can be found in the Data Card along with details about the performed Feature Selection.
The choice of the number of clusters (denoted by k) was made by evaluating the Silhouette Score and two criteria, which led us to select 5 as the optimal value for k in our experiment.
The criteria used to determine the optimal number of clusters are as follows:
-
For a given k, all clusters should have a silhouette score higher than the average score of the dataset (represented by the red dotted line in each plot).
-
Additionally, there should not be wide fluctuations in the size of the clusters (the width of the clusters in the plot represents their size).

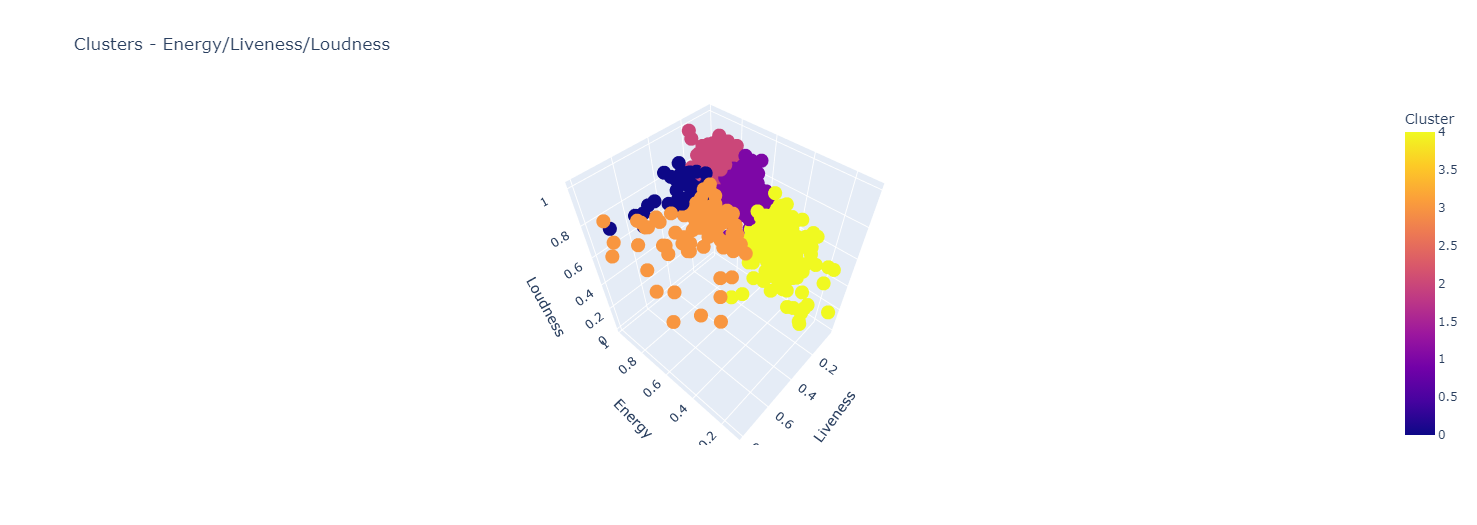
In our experiment, with k = 5, K-Medoids computed the following clusters.
Here, we can observe the clusters of the training dataset.

Here, instead, we can observe the clusters of the test dataset.
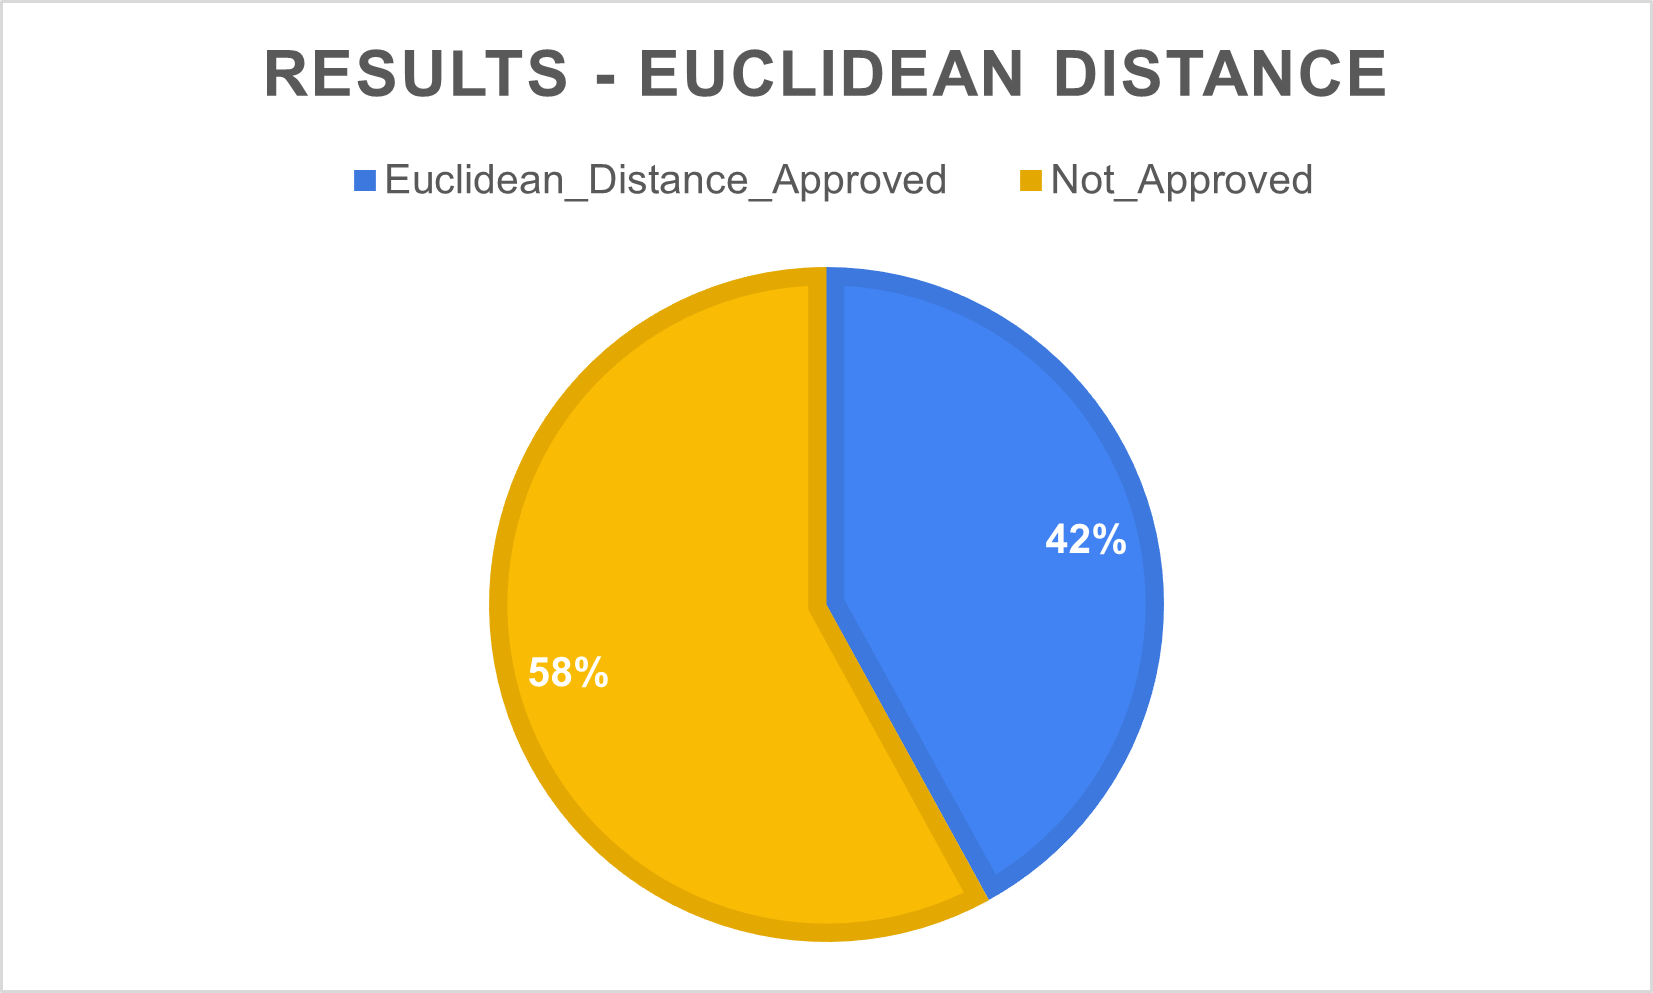
Using the computed clusters, and randomly picking a song from the training set, the system suggests the 5 most similar songs from the test set, based on their features. The Euclidean Distance has been used to compute the most similar songs.
Here's an example of song suggestions provided by our model.

Primary intended uses:
-
The user can augment their playlist selection by inputting the ID of playlists they or other users have created on Spotify. Playlists created by Spotify cannot be utilized for this purpose. The extracted playlists can then function as either the training or test set for the system.
-
The user selects a Spotify playlist which contains the user’s preferred songs (train set), then the model computes the clusters and suggests 5 songs picked from a selected test playlist, which are the closest in terms of song’s features to a random song previously picked from the train set. Both the train set and test set can be either default playlists or playlists extracted by the user.
Primary intended users:
- The model is intended to be used from whoever wants song suggestions based on their preferences.
We conducted user testing involving users to gather their feedback: each user was asked to provide feedback on the system's performance, particularly regarding song recommendations, indicating if the song suggested is liked or not.
Moreover, in our experiment, we solicited the opinions of only 10 users to rate the suggested songs as "Liked" or "Not Liked" based on the song used for the suggestions. Following the computed cluster and the results of this initial test.
As suggested in the Carbon emissions Section in Hugging Face's Model Card webpage, we offer insights into our model's carbon footprint. Tracking and reporting emissions are crucial for understanding the environmental impact of our field.
We used Code Carbon to track our emissions. This tool allows us to assess the environmental impact of code by estimating its carbon footprint.
co2_eq_emissions:
  emissions: 2.4699354187091408e-05 (in grams of CO2)
  source: Code Carbon
  geographical_location: Apulia, Italy
  hardware_used: 12th Gen Intel(R) Core(TM) i7-12650H and NVIDIA GeForce RTX 3050 6GB Laptop GPU
To clarify the very small value for the emissions, we reported the emissions value for a test scenario using our default dataset.
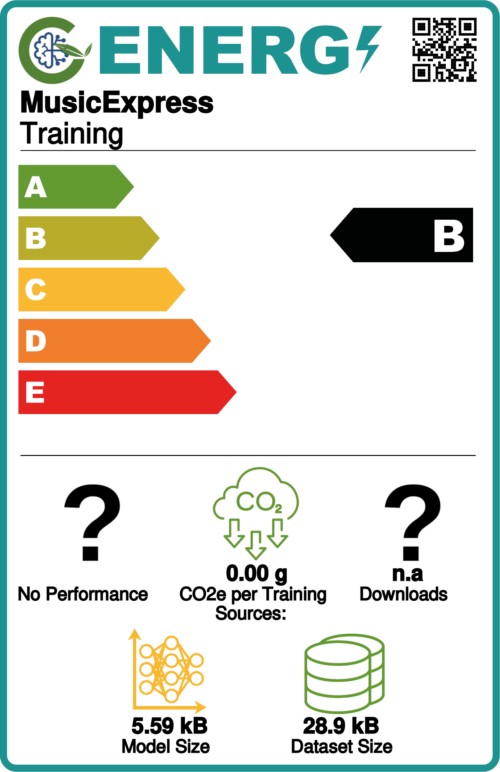
We also report the efficiency card computed on the Energy Label website.
Use the following command to access to the Code Carbon Dashboard:
carbonboard --filepath="reports\codecarbon\emissions.csv" --port=port_number
