Skip to content
New issue

Have a question about this project? Sign up for a free GitHub account to open an issue and contact its maintainers and the community.

By clicking “Sign up for GitHub”, you agree to our terms of service and privacy statement. We’ll occasionally send you account related emails.

Already on GitHub? Sign in to your account

Unable to use extent for currency data #64

Open
ronakrrb opened this issue Dec 10, 2013 · 2 comments
Open

Unable to use extent for currency data #64

ronakrrb opened this issue Dec 10, 2013 · 2 comments

Comments

@ronakrrb
Copy link

    var context = cubism.context()
      .serverDelay(0)
      .clientDelay(0)
      .step(1e3)
      .size(960);

    function money(name) {
      var value = 0,
          values = [],
          i = 0,
          last;
      return context.metric(function(start, stop, step, callback) {
        $.getJSON("Website Link", function (api_data) {
          start = +start, stop = +stop;
          if (isNaN(last)) last = start;
          while (last < stop) {
            last += step;
            values.push(_.where(api_data,{"code": name})[0].rate);
          }
          callback(null, values = values.slice((start - stop) / step));
        });
      }, name);
    }

        var USD = money("USD"),
            EUR = money("EUR");
            INR = money("INR");

        d3.select(selection).call(function(div) {

          div.append("div")
              .attr("class", "axis")
              .call(context.axis().orient("top"));

          div.selectAll(".horizon")
              .data([USD, EUR, INR])
            .enter().append("div")
              .attr("class", "horizon")
              .call(context.horizon().format(d3.format(".2f")));

          div.append("div")
              .attr("class", "rule")
              .call(context.rule());

        });

        // On mousemove, reposition the chart values to match the rule.
        context.on("focus", function(i) {
          d3.selectAll(".value").style("right", i == null ? null : context.size() - i + "px");
        });

I am using the above code and the entire band for all the three currencies is having green color without the rates' variation. Check the image
image

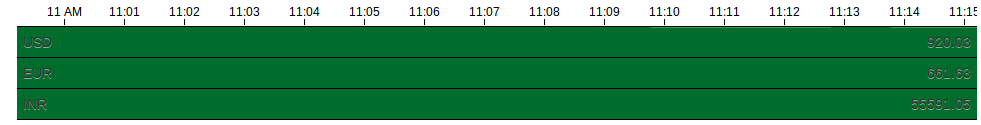
Please help me out.!!! :(

@ronakrrb
Copy link
Author

I have figured out a solution. I now just need to have the data explicitly from the metric and do some calculation to set the extent. Can any one help me with getting the data from metric explicitly

@Glavin001
Copy link

My chart data is looking the same (solid, filled in, output). Did you find a solution for this?

Sign up for free to join this conversation on GitHub. Already have an account? Sign in to comment
Labels
None yet
Projects
None yet
Development

No branches or pull requests

2 participants