-
Notifications
You must be signed in to change notification settings - Fork 5
ACI workflow
html { min-height:100%; margin-bottom:1px; } html body { height:100%; margin:0px; font-family:Arial, Helvetica, sans-serif; font-size:10px; color:#000; line-height:140%; background:#fff none; overflow-y:scroll; } html body td { vertical-align:top; text-align:left; }
h1 { padding:0px; margin:0px 0px 25px; font-family:Arial, Helvetica, sans-serif; font-size:1.5em; color:#d55000; line-height:100%; font-weight:normal; } h2 { padding:0px; margin:0px 0px 8px; font-family:Arial, Helvetica, sans-serif; font-size:1.2em; color:#000; font-weight:bold; line-height:140%; border-bottom:1px solid #d6d4d4; display:block; } h3 { padding:0px; margin:0px 0px 5px; font-family:Arial, Helvetica, sans-serif; font-size:1.1em; color:#000; font-weight:bold; line-height:140%; }
a { color:#005fce; text-decoration:none; } a:hover { color:#005fce; text-decoration:underline; } a:visited { color:#004aa0; text-decoration:none; }
p { padding:0px; margin:0px 0px 20px; } img { padding:0px; margin:0px 0px 20px; border:none; } p img, pre img, tt img, li img { margin-bottom:0px; }
ul { padding:0px; margin:0px 0px 20px 23px; list-style:square; } ul li { padding:0px; margin:0px 0px 7px 0px; } ul li ul { padding:5px 0px 0px; margin:0px 0px 7px 23px; } ul li ol li { list-style:decimal; } ol { padding:0px; margin:0px 0px 20px 0px; list-style:decimal; } ol li { padding:0px; margin:0px 0px 7px 23px; list-style-type:decimal; } ol li ol { padding:5px 0px 0px; margin:0px 0px 7px 0px; } ol li ol li { list-style-type:lower-alpha; } ol li ul { padding-top:7px; } ol li ul li { list-style:square; }
.content { font-size:1.2em; line-height:140%; padding: 20px; }
pre, tt, code { font-size:12px; } pre { margin:0px 0px 20px; } pre.error { color:red; } pre.codeinput { padding:10px; border:1px solid #d3d3d3; background:#f7f7f7; } pre.codeoutput { padding:10px 11px; margin:0px 0px 20px; color:#4c4c4c; }
@media print { pre.codeinput, pre.codeoutput { word-wrap:break-word; width:100%; } }
span.keyword { color:#0000FF } span.comment { color:#228B22 } span.string { color:#A020F0 } span.untermstring { color:#B20000 } span.syscmd { color:#B28C00 }
.footer { width:auto; padding:10px 0px; margin:25px 0px 0px; border-top:1px dotted #878787; font-size:0.8em; line-height:140%; font-style:italic; color:#878787; text-align:left; float:none; } .footer p { margin:0px; } .footer a { color:#878787; } .footer a:hover { color:#878787; text-decoration:underline; } .footer a:visited { color:#878787; }
table th { padding:7px 5px; text-align:left; vertical-align:middle; border: 1px solid #d6d4d4; font-weight:bold; } table td { padding:7px 5px; text-align:left; vertical-align:top; border:1px solid #d6d4d4; }
</style>
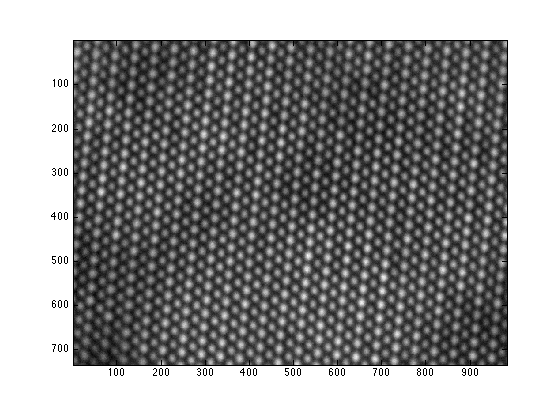
- load the RevSTEM image. The gray-scale image is loaded to the variable 'ImageSum_R'
- display the RevSTEM image
- find the atom column locations using normalized cross correlation data
- find the atom column locations using experimental RevSTEM data
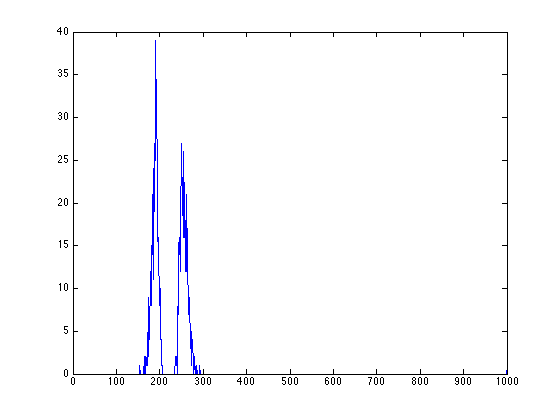
- distance histogram calculated from the fitting result
- calculate PSD for the example image
- we can then use the point-PSD to find exactly locations of peaks at roughly 85 degrees and -5 degrees (175 degrees in the plot)
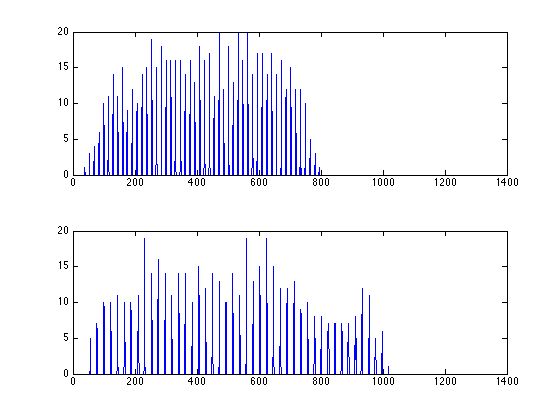
- note the output from matlab says 'find image aligned a long xxx degree at index yyy', use the index yyy to plot the projected profile
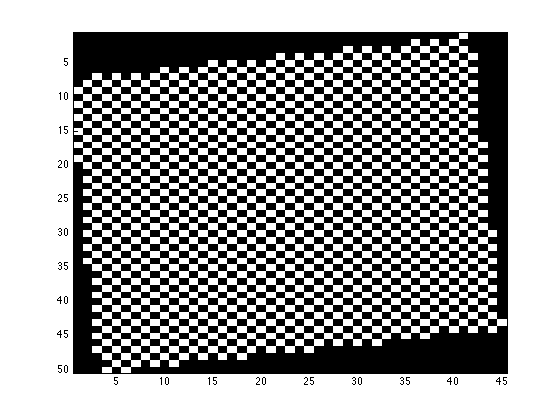
- the matrix representation is stored in 'mini_E'
the RevSTEM image has not been filtered note that our code can also work on regular STEM images the 'serReader.m' script can be used to read a converntiaonl STEM image acquired by TIA
load example.mat
figure;
imagesc(ImageSum_R);
axis image;
colormap(gray);
function [fitresult,oimage,zfit, fiterr, zerr, resnorm,... rr,image1,image2,object_index,mass_center,C,D,StartPoint,h_area]=... find_atomic_columns(raw_image,sigma,threshold,max_peak_num,sign,style,... area_threshold,initial_values,fit_shift,verbose);
% the main output 'fitresult_N' has a cell structure, % each cell is a 1x7 array [amp, ang, sx, sy, xo, yo, zo] containing the peak fitting result % amp: amplitude % ang: rotation angle of the two main axes % sx: sigma along the first main axis % sy: sigma along the second main axis % xo: x coordinate of the peak center % yo: y coordinate of the peak center % zo: background intensity% Meaning of inputs of 'find_atom_clolumns' % raw_image: The input STEM image % sigma: sigma of the gaussian distribution for normalized cross-correlation, % when the number is 0, the program decides the best sigma for ncc % threshold: threshold to separate the atom columns % max_peak_num: the limit of peak numbers % sign: 1: find the peaks; 2: find the valleys (for ABF) % style: 1: use ncc data to fit the peak; 2: use experimental data % area_threshold: only areas within the area_threshold range are used for fitting % initial_values: starting values for peak fitting, can be set as 0 % fit_shift: for future use, 0 % verbose: show the ncc threshold map and area size histogram [fitresult_N,oimage,zfit, fiterr, zerr, resnorm, rr,image1,image2,object_index,mass_center_N]=... find_atomic_columns(ImageSum_R,0,0.1,6000,1,1,[100 400],0,0,1);
gaussian template sigma=8 total peaks found: 974 areas range from 154 to 37563 peaks with areas larger than 10 pixels: 974 peaks with areas larger than 20 pixels: 974
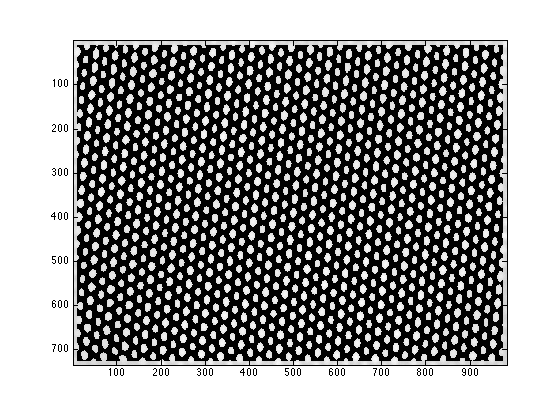
style is set to 2 to use experimental data for fitting starting points are set to be fitresult_N
[fitresult_E,oimage_E,zfit_E, fiterr_E, zerr_E, resnorm_E, rr_E,image1_E,image2_E,startpoint_E,mass_center_E]=...
find_atomic_columns(ImageSum_R,0,0.1,6000,1,2,[100 400],fitresult_N,0,0);
gaussian template sigma=8 total peaks found: 974 areas range from 154 to 37563 peaks with areas larger than 10 pixels: 974 peaks with areas larger than 20 pixels: 974
figure; [xydist_E,h_E]=position_analysis(fitresult_E,ImageSum_R,300,30); plot(h_E);
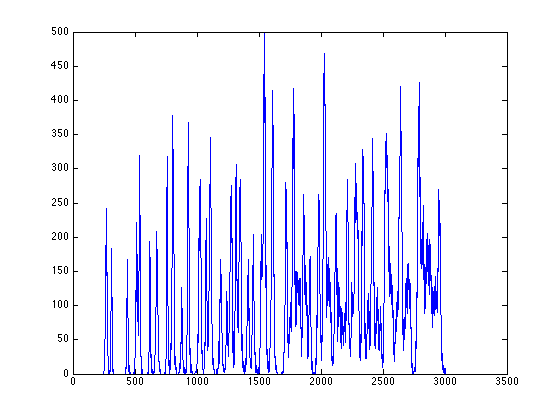
figure; [Iproj,Iavg,Istd]=project_image_RD(ImageSum_R,100,-90:1:90); plot(Istd);
Elapsed time is 5.352220 seconds.
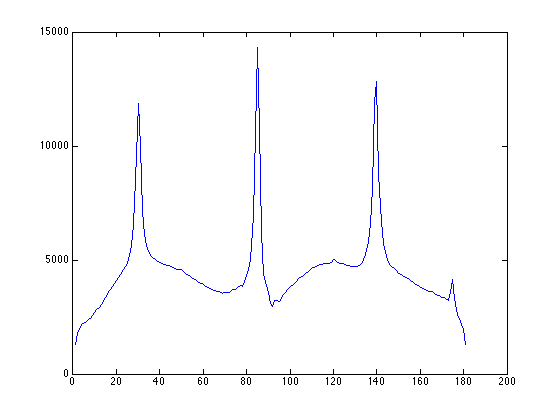
we can then use the point-PSD to find exactly locations of peaks at roughly 85 degrees and -5 degrees (175 degrees in the plot)
figure;
[d_E,proj_acc_E,projx_E,peak_index_E,row_map_E,col_map_E,mini_E,row_stat_E,col_stat_E,coord_angle_E]...
=assign_xy_to_peaks(ImageSum_R,fitresult_E,200,-5,85,1,1);
plot(projx_E);
find image aligned along -6.100000 degree at index 40 find image aligned along 84.100000 degree at index 143
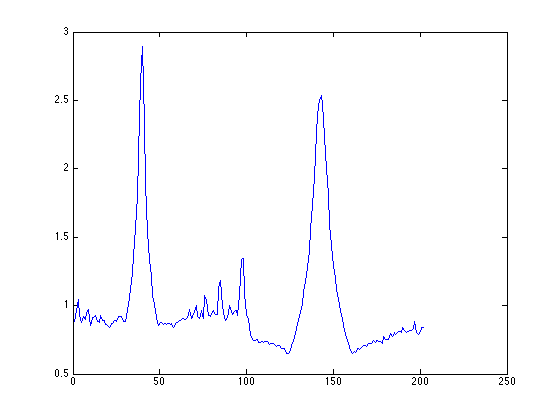
note the output from matlab says 'find image aligned a long xxx degree at index yyy', use the index yyy to plot the projected profile
figure; subplot(2,1,1); plot(proj_acc_E(40,:)); subplot(2,1,2); plot(proj_acc_E(143,:));
mini_E is a 2D matrix with each node containing the index of the peak fitting result in fitresult_R
figure; imagesc(mini_E>0); daspect([1 sqrt(2) 1]); colormap(gray);
%% load the RevSTEM image. The gray-scale image is loaded to the variable 'ImageSum_R' % the RevSTEM image has not been filtered % note that our code can also work on regular STEM images % the 'serReader.m' script can be used to read a converntiaonl STEM image % acquired by TIA
load example.mat
%% display the RevSTEM image
figure; imagesc(ImageSum_R); axis image; colormap(gray);
%% find the atom column locations using normalized cross correlation data % function [fitresult,oimage,zfit, fiterr, zerr, resnorm,... % rr,image1,image2,object_index,mass_center,C,D,StartPoint,h_area]=... % find_atomic_columns(raw_image,sigma,threshold,max_peak_num,sign,style,... % area_threshold,initial_values,fit_shift,verbose);
% the main output 'fitresult_N' has a cell structure,
% each cell is a 1x7 array [amp, ang, sx, sy, xo, yo, zo] containing the peak fitting result
% amp: amplitude
% ang: rotation angle of the two main axes
% sx: sigma along the first main axis
% sy: sigma along the second main axis
% xo: x coordinate of the peak center
% yo: y coordinate of the peak center
% zo: background intensity
% Meaning of inputs of 'find_atom_clolumns'
% raw_image: The input STEM image
% sigma: sigma of the gaussian distribution for normalized cross-correlation,
% when the number is 0, the program decides the best sigma for ncc
% threshold: threshold to separate the atom columns
% max_peak_num: the limit of peak numbers
% sign: 1: find the peaks; 2: find the valleys (for ABF)
% style: 1: use ncc data to fit the peak; 2: use experimental data
% area_threshold: only areas within the area_threshold range are used for fitting
% initial_values: starting values for peak fitting, can be set as 0
% fit_shift: for future use, 0
% verbose: show the ncc threshold map and area size histogram
[fitresult_N,oimage,zfit, fiterr, zerr, resnorm, rr,image1,image2,object_index,mass_center_N]=...
find_atomic_columns(ImageSum_R,0,0.1,6000,1,1,[100 400],0,0,1);
%% find the atom column locations using experimental RevSTEM data % style is set to 2 to use experimental data for fitting % starting points are set to be fitresult_N [fitresult_E,oimage_E,zfit_E, fiterr_E, zerr_E, resnorm_E, rr_E,image1_E,image2_E,startpoint_E,mass_center_E]=... find_atomic_columns(ImageSum_R,0,0.1,6000,1,2,[100 400],fitresult_N,0,0);
%% distance histogram calculated from the fitting result figure; [xydist_E,h_E]=position_analysis(fitresult_E,ImageSum_R,300,30); plot(h_E);
%% calculate PSD for the example image figure; [Iproj,Iavg,Istd]=project_image_RD(ImageSum_R,100,-90:1:90); plot(Istd);
%% we can then use the point-PSD to find exactly locations of peaks at roughly 85 degrees and -5 degrees (175 degrees in the plot) figure; [d_E,proj_acc_E,projx_E,peak_index_E,row_map_E,col_map_E,mini_E,row_stat_E,col_stat_E,coord_angle_E]... =assign_xy_to_peaks(ImageSum_R,fitresult_E,200,-5,85,1,1); plot(projx_E);
%% note the output from matlab says 'find image aligned a long xxx degree at index yyy', use the index yyy to plot the projected profile
figure;
subplot(2,1,1); plot(proj_acc_E(40,:));
subplot(2,1,2); plot(proj_acc_E(143,:));
%% the matrix representation is stored in 'mini_E' % mini_E is a 2D matrix with each node containing the index of the peak % fitting result in fitresult_R
figure;
imagesc(mini_E>0);
daspect([1 sqrt(2) 1]);
colormap(gray);
-->