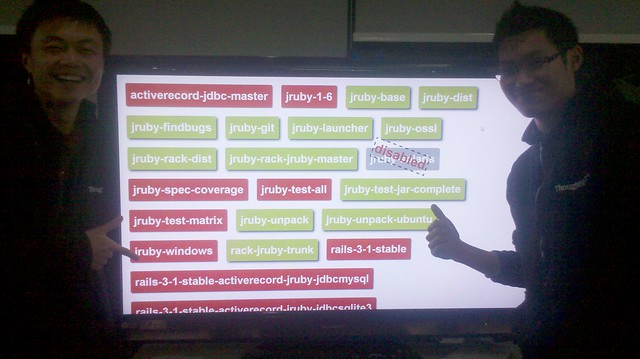
Jenkins Monitor shows the status of build in blue (building), red (failure), green (success) box on jenkins. By using jquery jsonp support and jenkins built-in jsonp reponse support, implementing this is just a piece of cake.
Furthermore it plays a sound when
- a build fails using google translate (e.g. ["Build 'sample' failed"] (http://translate.google.com/translate_tts?q=buildsamplefailed&tl=en))
- a build is successfully
It's very important to radiate build status on jenkins(passively). So that everybody in the team can just raise your head a little bit and take a look at the builds on screen(it could be in big TV),whether it is red/blue/green. Also it borrows very similar metaphor from Test Driven Development rhythm. Red color box means that build is failed, someonebody in the team may need to take a look at it;Green means "yep, success";Blue means that build currently is building; Grey means that build is aborted or disabled.
git clone git://github.com/svenmueller/jenkins-monitor.git
Then copy or rename conf/config.js.sample to conf/config.js:
copy conf/config.js.sample conf/config.js
or
mv conf/config.js.sample conf/config.js

And open conf/config.js to change your jenkins ci address and jobs name you want to show on dashboard like following:

	var config = {
		ci_url: 'http://build.domain.de',
		jobs_to_be_filtered: ["job"],					# whitelist, optional, string or regular expression
		jobs_to_be_excluded: ["old-job","unused-job"],	# blacklist, optional, string or regular expression
		remove_string_in_name: "redundant-name" 		# shorten name, optional, string or regular expression
	}
Then run from command line:
open index.html -a "/Applications/Google Chrome.app"
Using Chrome or Safari is recommended. If you have lots of job, use Chrome and set browser zoom to the proper value so that you can see all the jobs at once (e.g. 25%).
