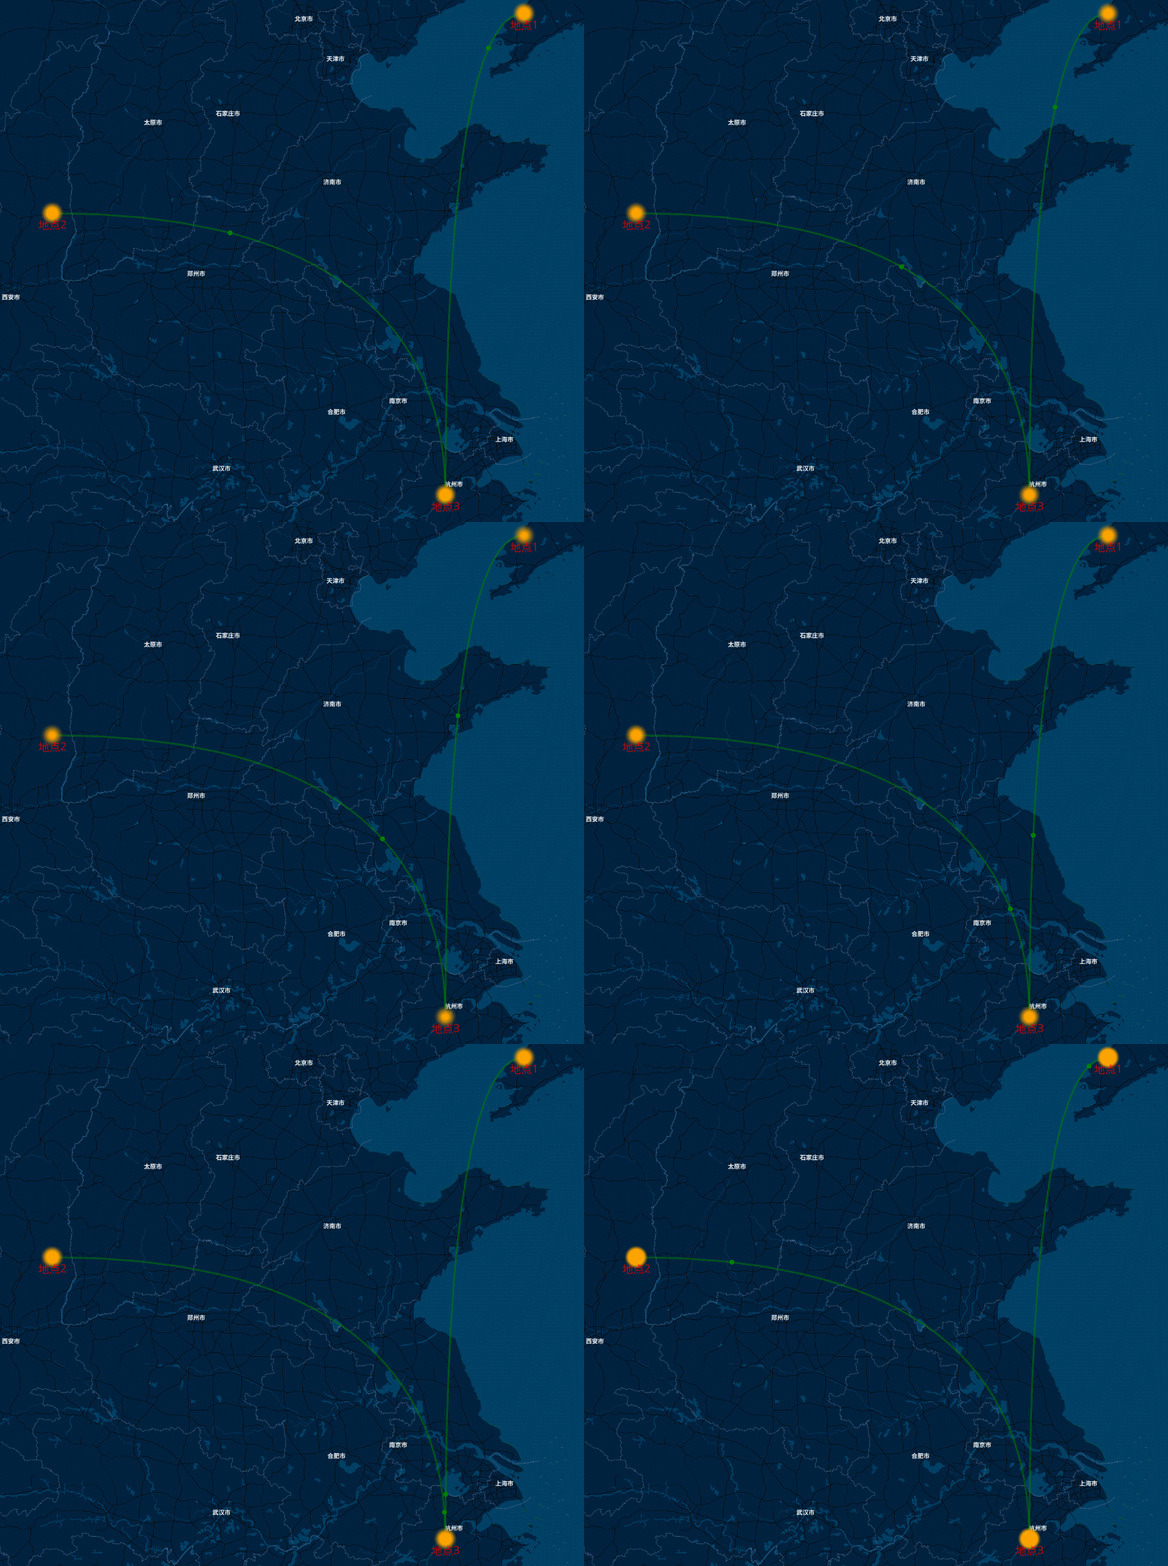
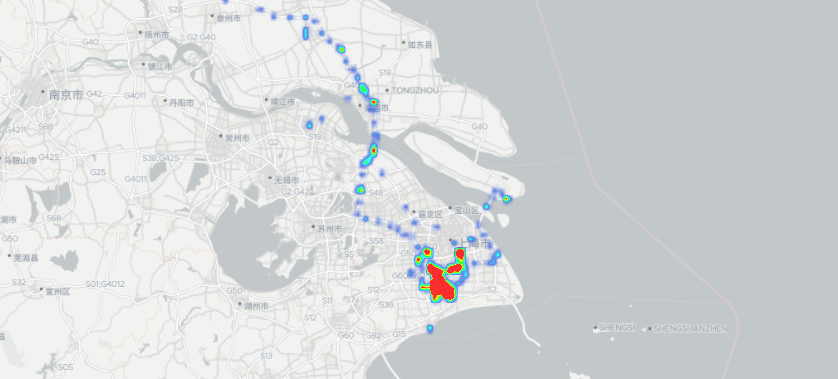
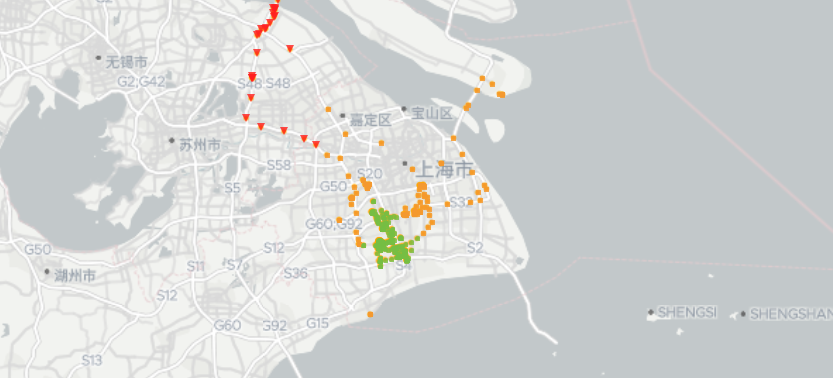
可以通过 npm 添加依赖
npm i vue-mapboxgl-components --save
或者通过 yarn 添加依赖
yarn add vue-mapboxgl-components
在 Vue 项目的 main.js 中写入以下内容:
import Vue from 'vue'
<!-- 引入组件的JavaScript文件 -->
import 'vue-mapboxgl-components'
<!-- 引入组件的CSS文件,如果没有CSS,Popups和Markers等元素将无效。 -->
import 'vue-mapboxgl-components/lib/vue-mapboxgl-components.css'
import App from './App.vue'

Vue.config.productionTip = false

new Vue({
  render: h => h(App)
}).$mount('#app')
以上代码便完成了 vue-mapboxgl-components 的引入。
开发环境已经搭建完毕,在需要使用可视化图表的页面通过 html 标签的形式使用,如:
<template>
  <div id="app">
    <mapview :map-config="mapConfig" :osm-config="osmConfig"
      :map-types="mapTypes" :line="lineData" :point="pointData"
      @pointClick="callback">
      <!-- markers、popup、control的配置在详细文档中有说明 -->
      <!-- <markers ... ></markers> -->
      <!-- <popup ... ></popup> -->
      <!-- <control ... ></control> -->
    </mapview>
  </div>
</template>

<script>
export default {
  name: 'app',
  data () {
    return {
      mapConfig: {
        <!-- 中心点 -->
        center: [120.142577, 30.27719],
        <!-- 缩放等级 -->
        zoom: 5,
        <!-- 视角俯视的倾斜角度 -->
        pitch: 0,
        <!-- 地图的旋转角度 -->
        bearing: 0,
        <!-- 地图的最小缩放等级 -->
        maxZoom: 0,
        <!-- 地图的最大缩放等级 -->
        minZoom: 22
      },
      osmConfig: {
        <!-- osm地址 -->
        osmUrl: 'http://xxx.xxx.xxx.xxx:8700',
        <!-- 地图样式 -->
        backgroundStyle: 'custombrightstyle'
      },
      <!-- 地图的可视化类型 -->
      mapTypes: ['line', 'point'],
      <!-- 线配置项 -->
      lineConfig: {
        color: 'green',
        width: 3,
        opacity: 0.5,
        useCurve: true,
        showAnimation: true,
        data: [
          [{ lng: 122, lat: 40 }, { lng: 120, lat: 30 }],
          [{ lng: 110, lat: 36 }, { lng: 120, lat: 30 }]
        ]
      },
      <!-- 点配置项 -->
      pointConfig: {
        useMultiColor: false,
        color: 'orange',
        textColor: 'red',
        showAnimation: true,
        opacity: 0.8,
        radius: 20,
        textOffset: 1,
        data: [
          { lng: 122, lat: 40, value: 10, name: '地点1' },
          { lng: 110, lat: 36, value: 30, name: '地点2' },
          { lng: 120, lat: 30, value: 10, name: '地点3' }
        ]
      }
    }
  },
  methods: {
    <!-- 响应事件 -->
    callback (data) {
      console.log(data)
    }
  }
}
</script>

<style lang="less">
html,body{
  margin: 0;
  width: 100%;
  height: 100%;
}
#app {
  width: 100%;
  height: 100%;
}
</style>


