-
-
Notifications
You must be signed in to change notification settings - Fork 345
Building and debugging with Qt Creator (Note ‐ obsolete)
This page discusses how to setup and use Qt Creator graphical integrated development environment (IDE) to explore and also debug EdgeTX source code.
- Configuring Qt Creator for EdgeTX
- Loading EdgeTX source tree into Qt Creator
- Building EdgeTX firmware with Qt Creator
- Editing source code with Qt Creator
With Qt Creator, you not only have a graphical option to build EdgeTX radio firmware, Companion and Simulator software, but also very comfortable way to edit the code and even more importantly to debug it. If you hook up to your radio's Serial-Wire-Debug (SWD) header of the mainboard a hardware debugger, it is possible to perform in-circuit-debugging of code running on the radios STM32 microcontroller. Some examples of hardware debuggers that can be used are, e.g. Segger J-Link (incl. the Mini EDU) and ST-Link/V2. With in-circuit-debugging, you are able to step through the code and do live variable inspection, which makes validating low level code much easier. For debugging high-level code, it is easier to use the radio firmware simulation library, running on your PC, not requiring a physical radio hardware hookup. Even if you might not be driven by the desire to change the existing EdgeTX codebase, running code in a debug session will provide you an in-depth insight into variables passed between the functions and can in general give a clearer view of how the EdgeTX runs under the hood.
If you followed the previous build instruction guides (irrespective if for Windows 10 or Ubuntu Linux 20.04), Qt Creator IDE is already installed on your system. The guide below uses screenshots from Windows, but provides info for correct paths in text for Ubuntu Linux as well.
We need to first configure Qt Creator to support building for ARM architecture and external debugging (so called bare-metal in Qt Creator lingo).
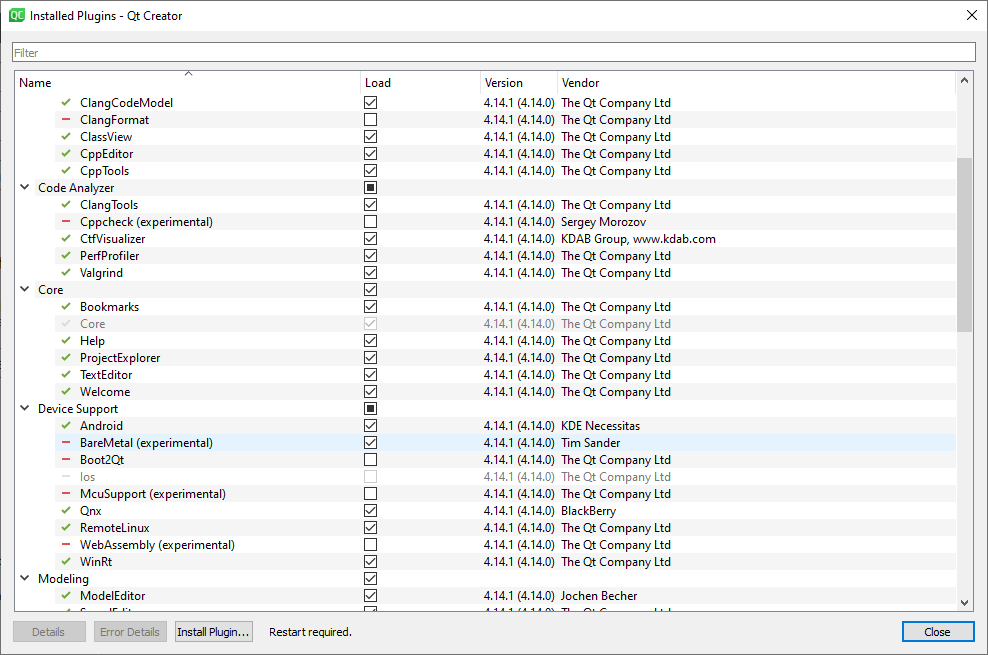
Launch Qt Creator by clicking on Start -> Qt -> Qt Creator. Navigate to menu Help and click About Plugins.... Under Device Support enable the BareMetal (experimental) plugin. Click Close
After this step, it is mandatory to restart Qt Creator, select Restart Now from the pop-up to restart Qt Creator.
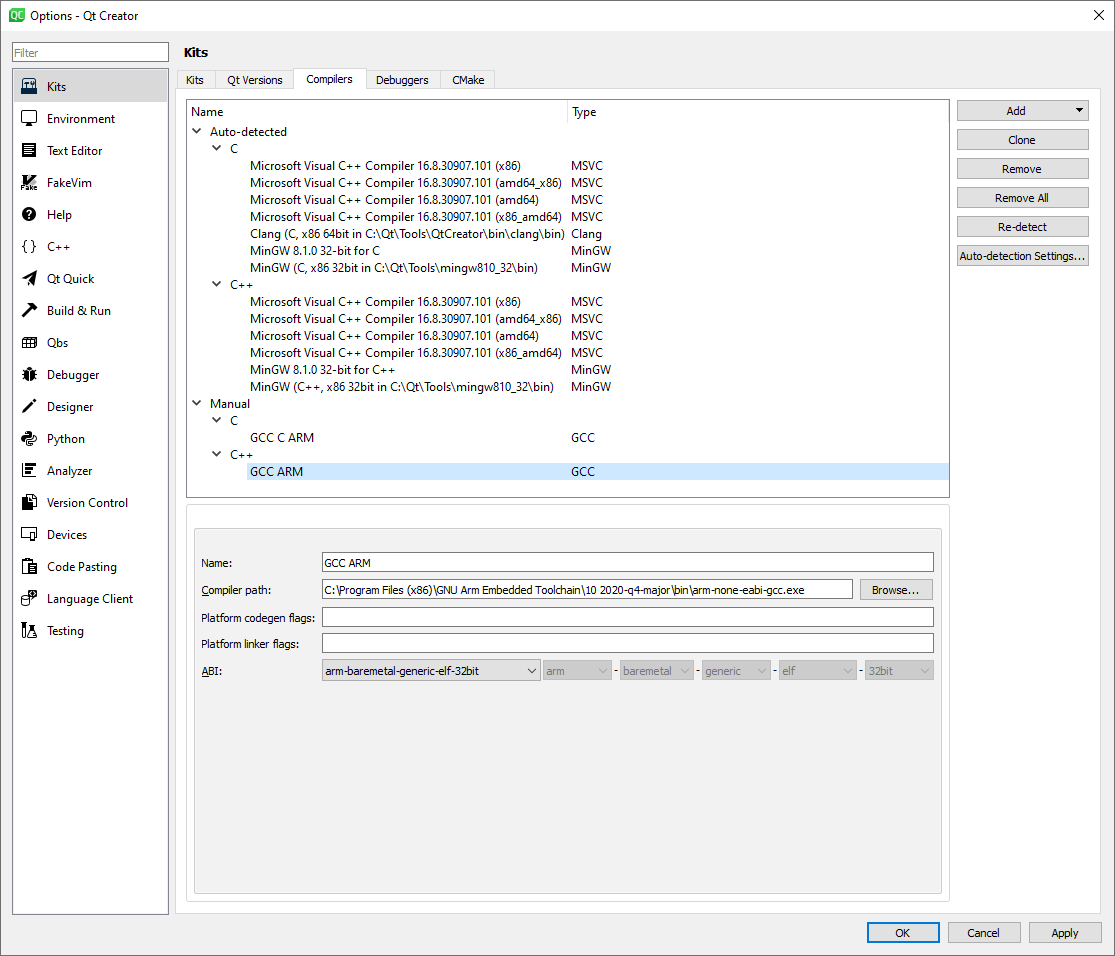
Open from menu Tools -> Options.... In the left pane Kits should already be selected, if not, select it. Open tab Compilers. Click Add -> GCC -> C. As name, enter for example GCC C ARM. Click Browse... behind field Compiler path and navigate and open
- Windows:
C:\Program Files (x86)\GNU Arm Embedded Toolchain\10 2020-q4-major\bin\arm-none-eabi-gcc.exe - Linux:
/opt/gcc-arm-none-eabi/bin/arm-none-eabi-gcc
Field ABI: should have automatically detected arm-baremetal-generic-elf-32bit. Click Apply.
Next, we add similarly C++ compiler. Click Add -> GCC -> C++. As name, enter for example GCC ARM and into field Compiler path enter the same arm-none-eabi-gcc binary as in the last step for plain C. Also here, field ABI: should have detected arm-baremetal-generic-elf-32bit. Click once more Apply. If everything went smoothly, the red exclamation marks should be gone.
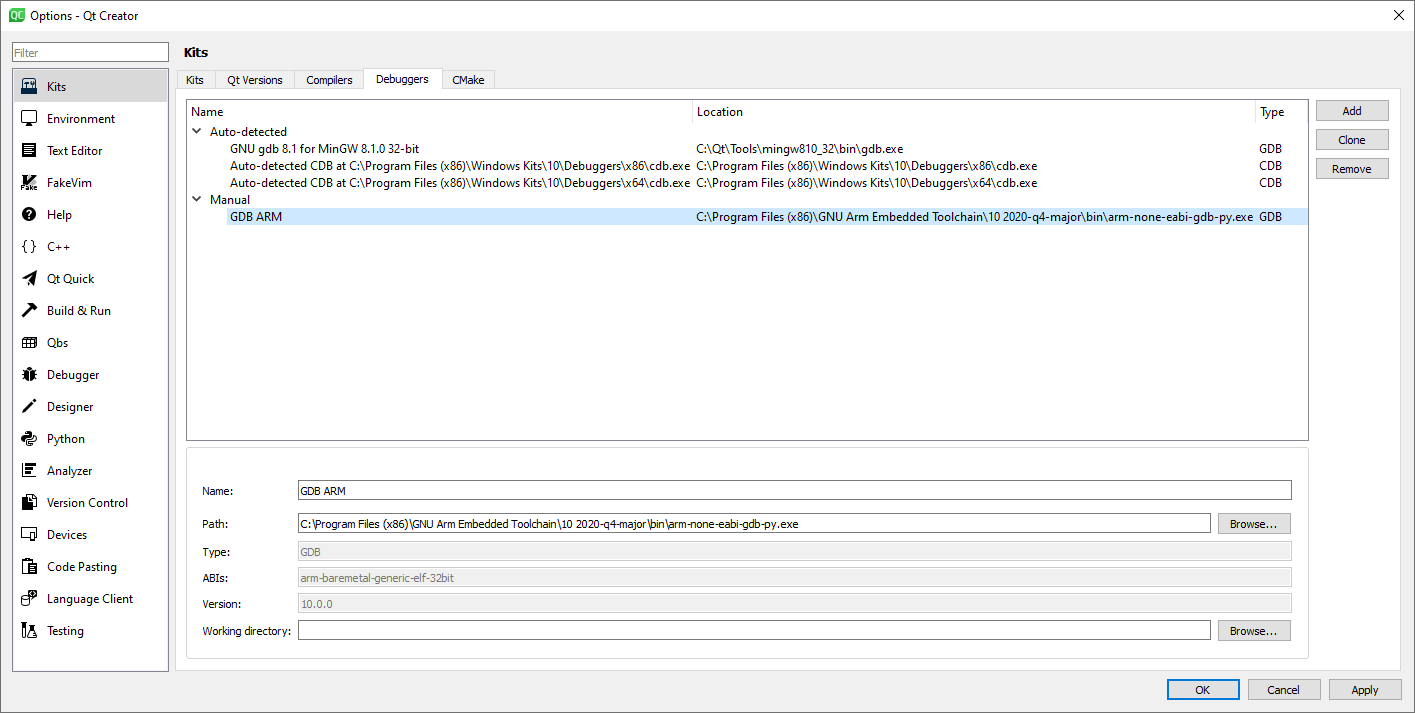
Navigate to Debuggers tab. Click Add, provide as name for example GDB ARM and click Browse... behind field Path:
Navigate to:
- Windows:
C:\Program Files (x86)\GNU Arm Embedded Toolchain\10 2020-q4-major\bin\arm-none-eabi-gdb-py.exe - Linux:
/opt/gcc-arm-none-eabi/bin/arm-none-eabi-gdb-py
and click Open. If Qt Creator is happy, then it should list in Type and ABIs fields that it found GDB for arm-baremetal-generic-elf-32bit. Click Apply.
If you plan to carry out in-circuit debugging, them install the drivers and software for your debugging hardware before continuing. For Segger J-Link/J-Trace, get the latest Segger J-Link software and documentation pack and install it. If your debugger stems from another manufacturer, you might want to consider the Open On-Chip Debugger or short OpenOCD. It supports huge variety of debugger hardware, but is less trivial to setup.
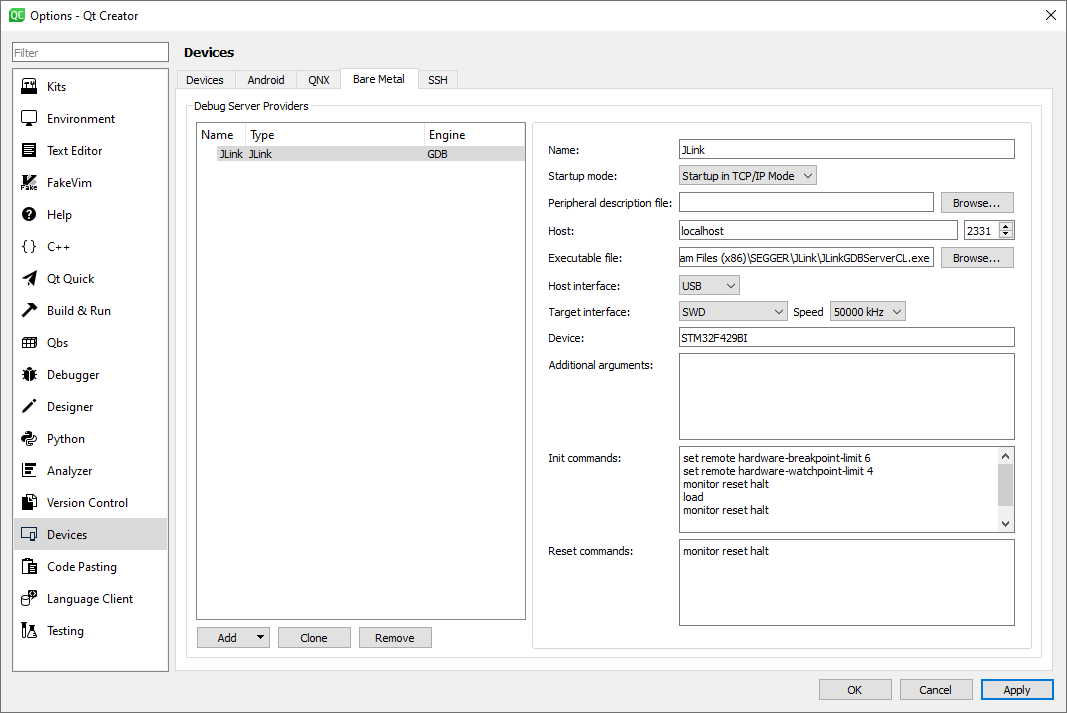
To add in-circuit-debugging to Qt Creator, start by navigating in the left pane of the Options dialog to Devices. Open tab Bare Metal, click Add and according to your debugger hardware choose either JLink or OpenOCD. The example below shows how to setup in-circuit-debugging with Segger J-Link/J-Trace.
click Browse... behind Executable file and open the command line version of J-Link GDB Server binary at:
- Windows:
C:\Program Files (x86)\SEGGER\JLink\JLinkGDBServerCL.exe - Linux:
/opt/SEGGER/JLink/JLinkGDBServer
Make sure the Target interface is set to SWD and adjust the speed according to your J-Link hardware (the following page lists the maximum target interface speed of Segger products). Under Device: use the STM32 chip according to your hardware. For Jumper T16 and RadioMaster TX16S, this is for example STM32F429BI. The remaining settings can be left at default, click Apply
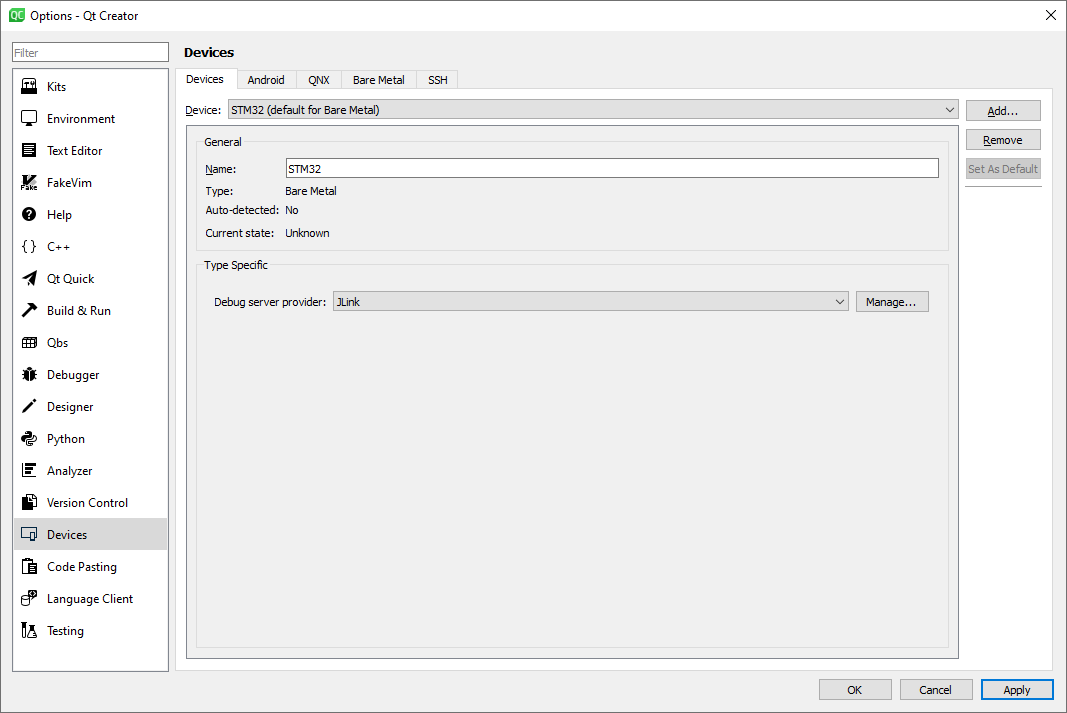
Navigate to tab Devices. Click Add.., pick Bare Metal Device and click Start Wizard. Give it a name, such as STM32. Pick a GDB server provider: according to your debugger hardware either JLink or OpenOCD. If you do not possess a debugger hardware, you can choose None here. Click Finish, click Apply.
This step gathers the options for building for STM32 microcontrollers that we have prepared in the last steps.
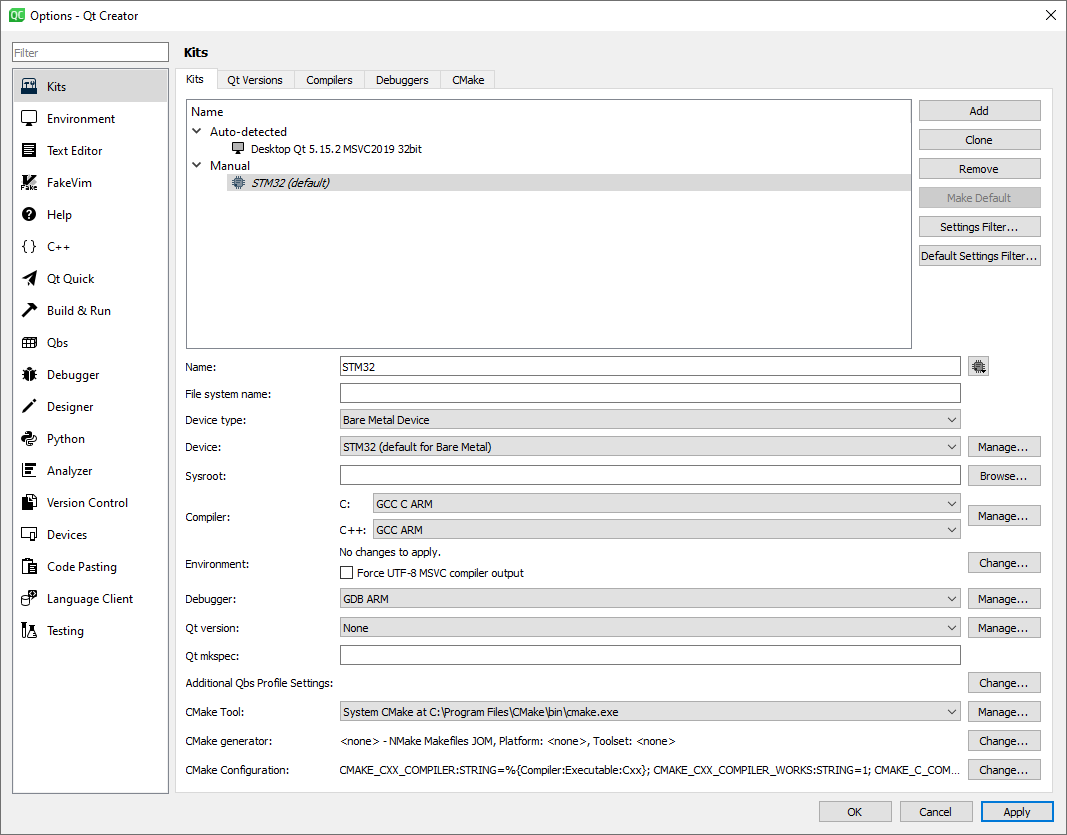
In the left pane of Qt Creator Options dialog, choose Kits and navigate to similarly named tab Kits. Add a new kit by clicking Add. Give it a name, like STM32. Under Device type: pick Bare Metal Device.
If under Device: STM32 (default for Bare Metal) is not already automagically selected, pick it from the drop-down box. In fields Compiler: choose our previously prepared GCC C ARM and GCC ARM options. For field Debugger:, choose our prepared GDB ARM. As there is no Qt code in our firmware for radio µC, select None for the Qt version. Click Apply.
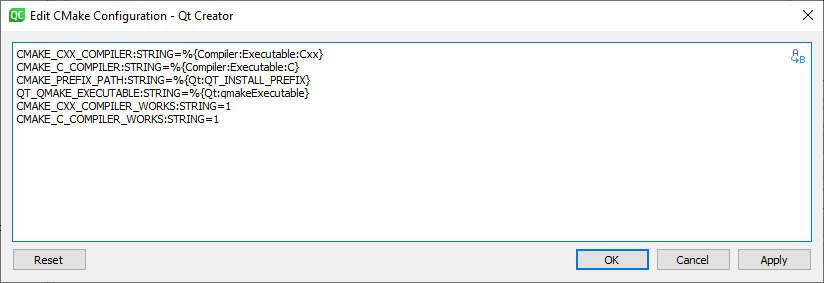
Next, we need to result to a trick to disable CMake to run a so called simple test, when loading a project. This is required to avoid a warning in present cross-compilation situation (cross-compilation here means that we compile for ARM architecture in STM32 microcontrollers under x86/x64 architecture). Click Change... behind CMake Configuration and append the following two lines in Edit CMake Configuration dialog:
CMAKE_CXX_COMPILER_WORKS:STRING=1
CMAKE_C_COMPILER_WORKS:STRING=1
and click OK for the Edit CMake Configuration dialog. Click Apply in the Qt Creator Options dialog.
Verify that in the Kits list, our newly created STM32 kit is selected, then click Make Default
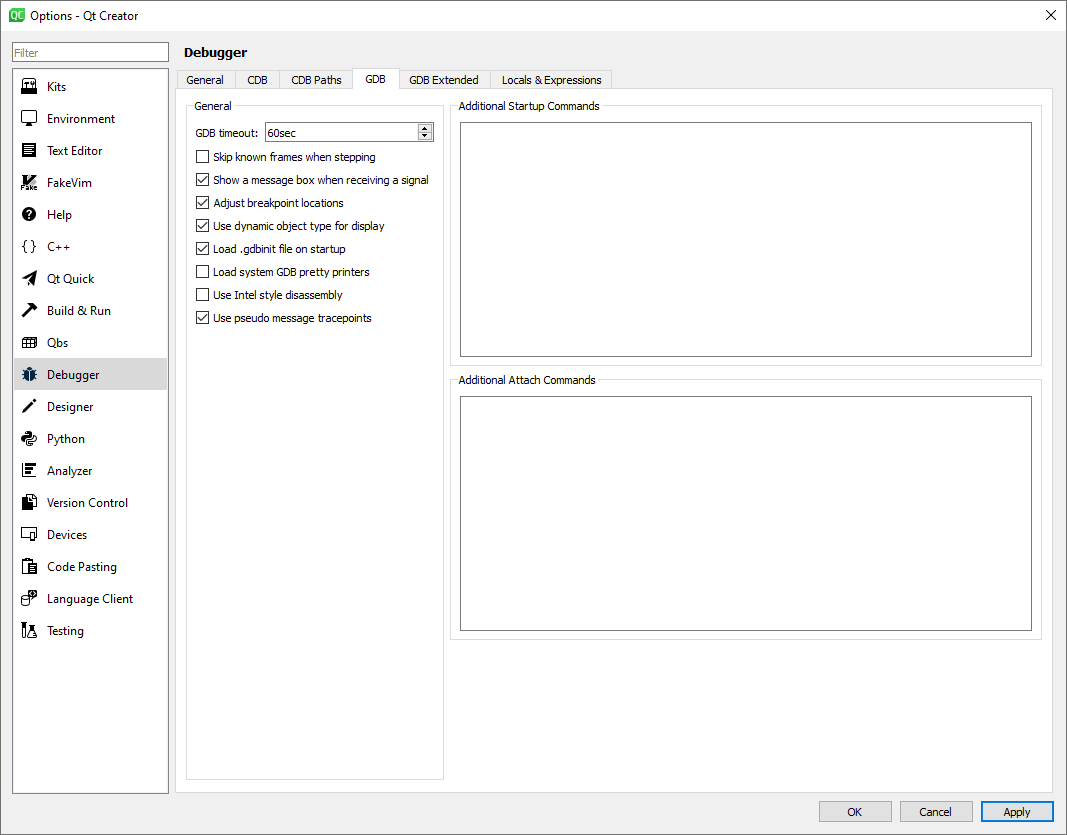
Depending on your hardware debugger maximum target speed, flashing STM32 µC in the radio can take some moments. The default wait time in Qt Creator for GNU debugger (GDB) is 20 seconds, which is typically a bit short for STM32 chips with larger memories and results in an unnecessary pop-up. Next, we will prolong the default waiting time. In the left pane of Qt Creator Options dialog click Debugger and navigate to GDB tab. Set GDB timeout, e.g. to 60 seconds:
Click OK to close the options dialog.
This concludes setting up Qt Creator for EdgeTX.
In the following, we assume that you followed the instructions setting up the build environment and building EdgeTX firmware (for Windows 10 or for Ubuntu 20.04) and have created a dedicated EdgeTX folder (C:\edgetx for Windows or ~/edgetx for Linux) and downloaded or git cloned EdgeTX source under this dedicated folder.
For the sake of clarity, we will create two new folders to put the output of our Qt build. Create two new empty folders:
- Windows:
C:\edgetx\build-edgetx-qt-fwandC:\edgetx\build-edgetx-qt-comp_sim_libsim - Linux:
~/edgetx/edgetx-v2.4/build-qt-fwand~/edgetx/edgetx-v2.4/build-qt-comp_sim_libsim
Back in Qt Creator, let's import next the EdgeTX source files into a project. From Qt Creator menu, choose File -> Open File or Project.... Open:
- Windows:
C:\edgetx\edgetx24\CMakeLists.txt - Linux:
~/edgetx/edgetx-v2.4/CMakeLists.txt
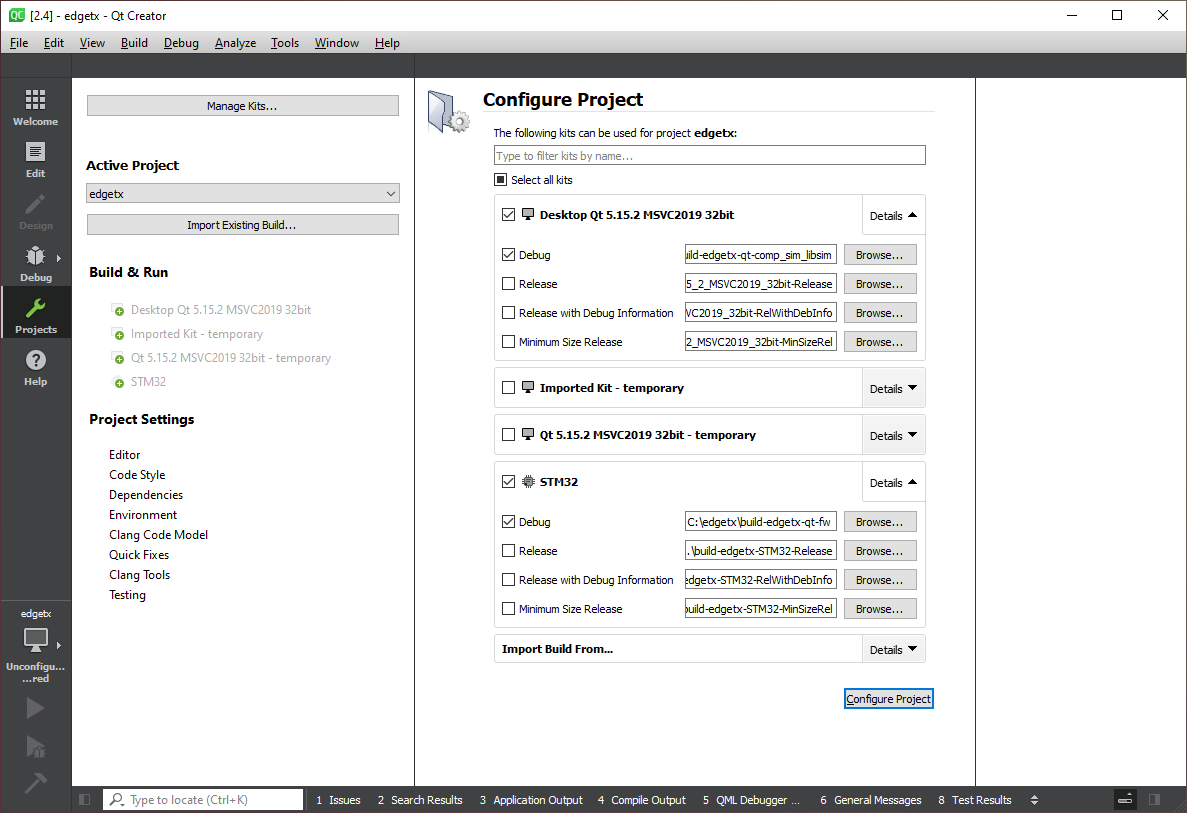
Next we need to pick the kits for building. If not already automatically selected, pick STM32 that is required for building firmware for ARM architecture. Presently, only under Ubuntu, you can also select Desktop to build Companion, Simulator and radio firmware simulator libraries. If there show up any Imported Kits, deselect them (typically only happens if you do not open the project for the first time).
Click Details behind STM32 to unfold a build type selection dialog. As we are presently only interested in debugging, leave it selected, but you can deselect all other three options (Release, Release with Debug Information and Minimum Size Release). Click Browse... behind Debug and open the following folder as build output location:
- Windows:
C:\edgetx\build-edgetx-qt-fw - Linux:
~/edgetx/edgetx-v2.4/build-qt-fw
If you opted for building also Companion, Simulator and radio firmware simulator libraries under Ubuntu, click Details behind Desktop and also here, leave only Debug selected. Click Browse... and provide ~/edgetx/edgetx-v2.4/build-qt-comp_sim_libsim as build target location.
Click Configure Project.
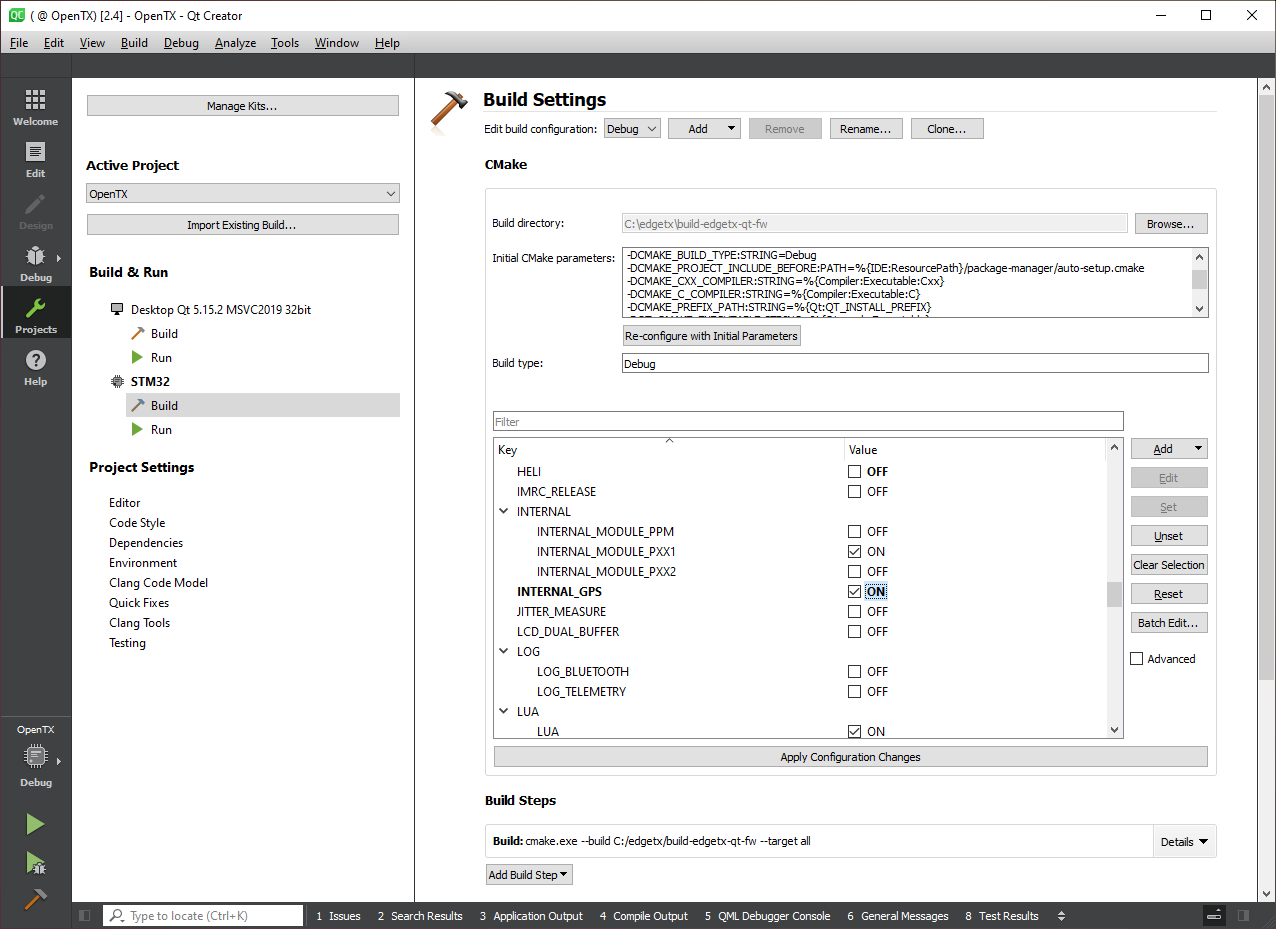
Click on Projects on the left vertical button bar (so called Mode Selector) and verify that STM32 -> Build is currently selected.
Qt Creator presents us the build configuration options as a selection list. These match the previous CMake command line options. As an example, we will select to build for RadioMaster TX16S using matching options we listed in the command line build example for Windows 10 and Ubuntu Linux 20.04 pages.
- Look for DEFAULT -> DEFAULT_MODE and enter 2 into the value field on the right
- GVARS should be already selected
- Disable HELI (if you like)
- LUA -> LUA should already be selected
- PCB list is presented as a drop-down options list, choose here
X10for TX16S - type in PCBREV field
TX16S(instead of default 2014) - under PPM -> PPM_UNIT, select US from the dropdown list
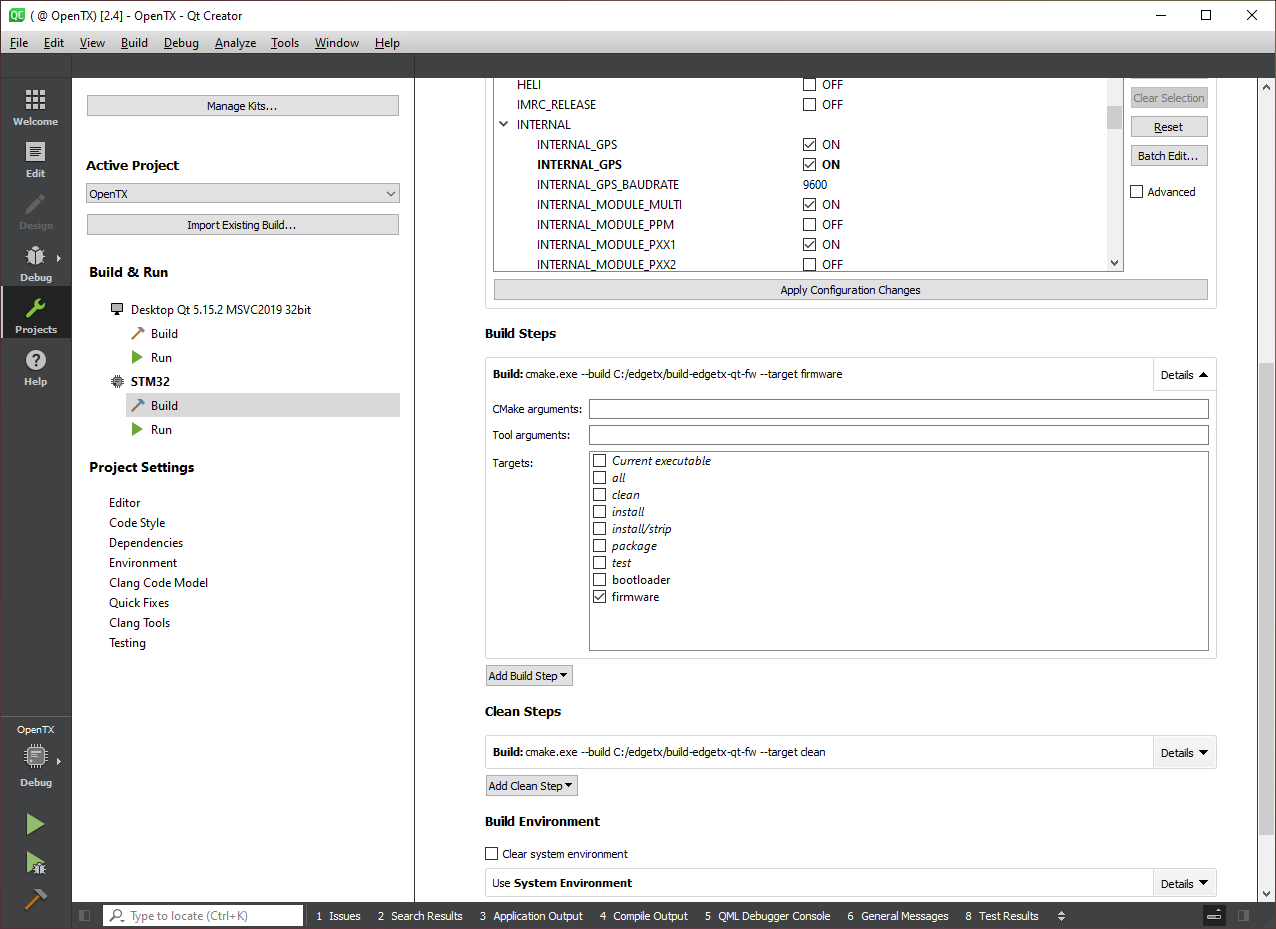
Please note that INTERNAL_GPS is not listed, so we need to add it manually. Click Add, select as type Boolean and type INTERNAL_GPS and select it (make the state to ON).
In case you plan performing in-circuit-debugging, you might want to turn off UNEXPECTED_SHUTDOWN, in order not to enter EdgeTX Emergency Mode screen on every boot that was not previously nicely shut-down. Be aware though that this has the potential to corrupt the file system on microSD card, thus ideally use a separate card for debugging, or at least make sure the file system is OK, before you go and fly with it.
Click Apply Configuration Settings. Please wait for the process to end, it can take some moments.
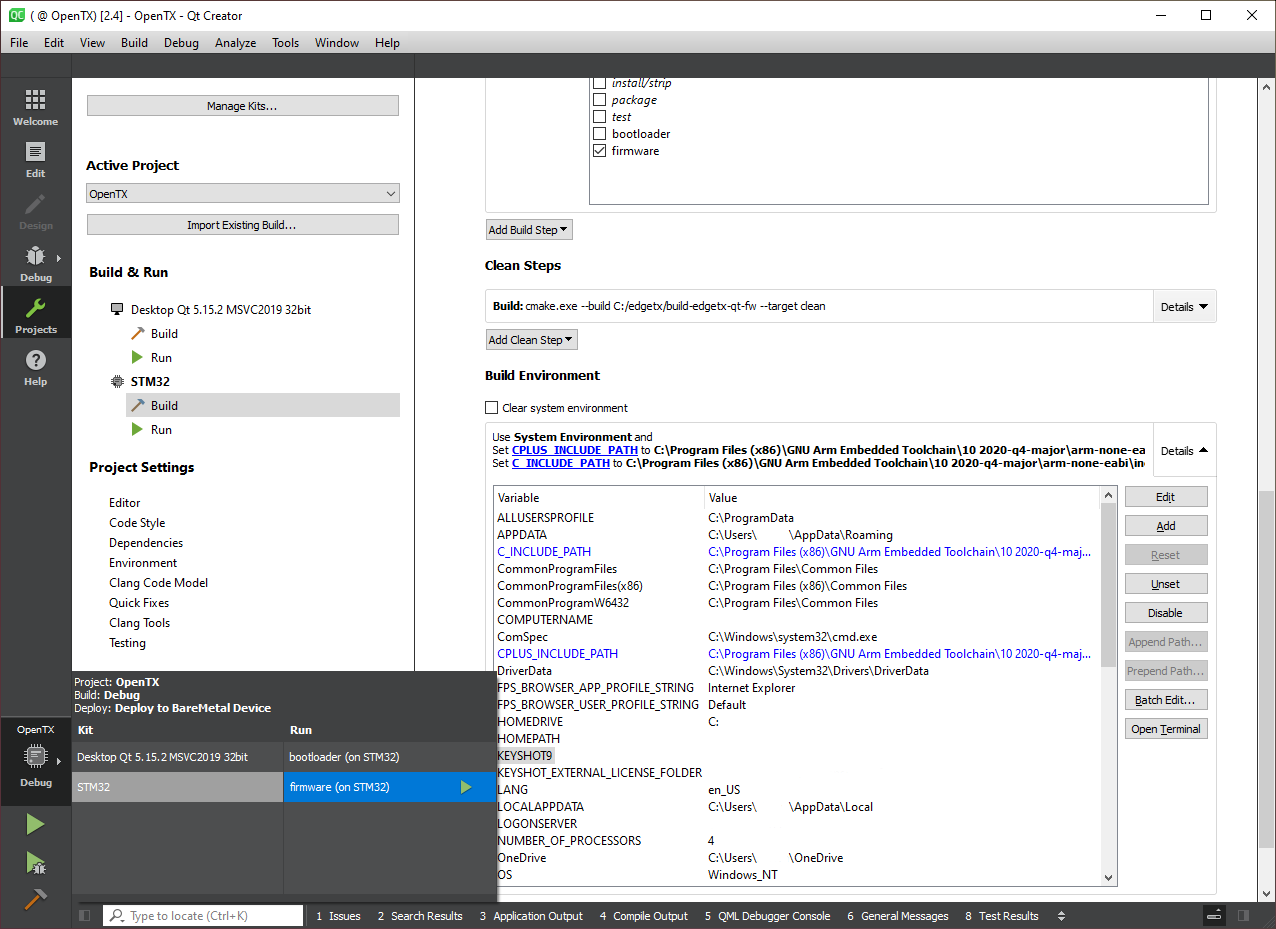
Under Build Steps, click Details to open a selection menu of what to build. Here, we only want to build and debug firmware, thus select firmware and then deselect all.
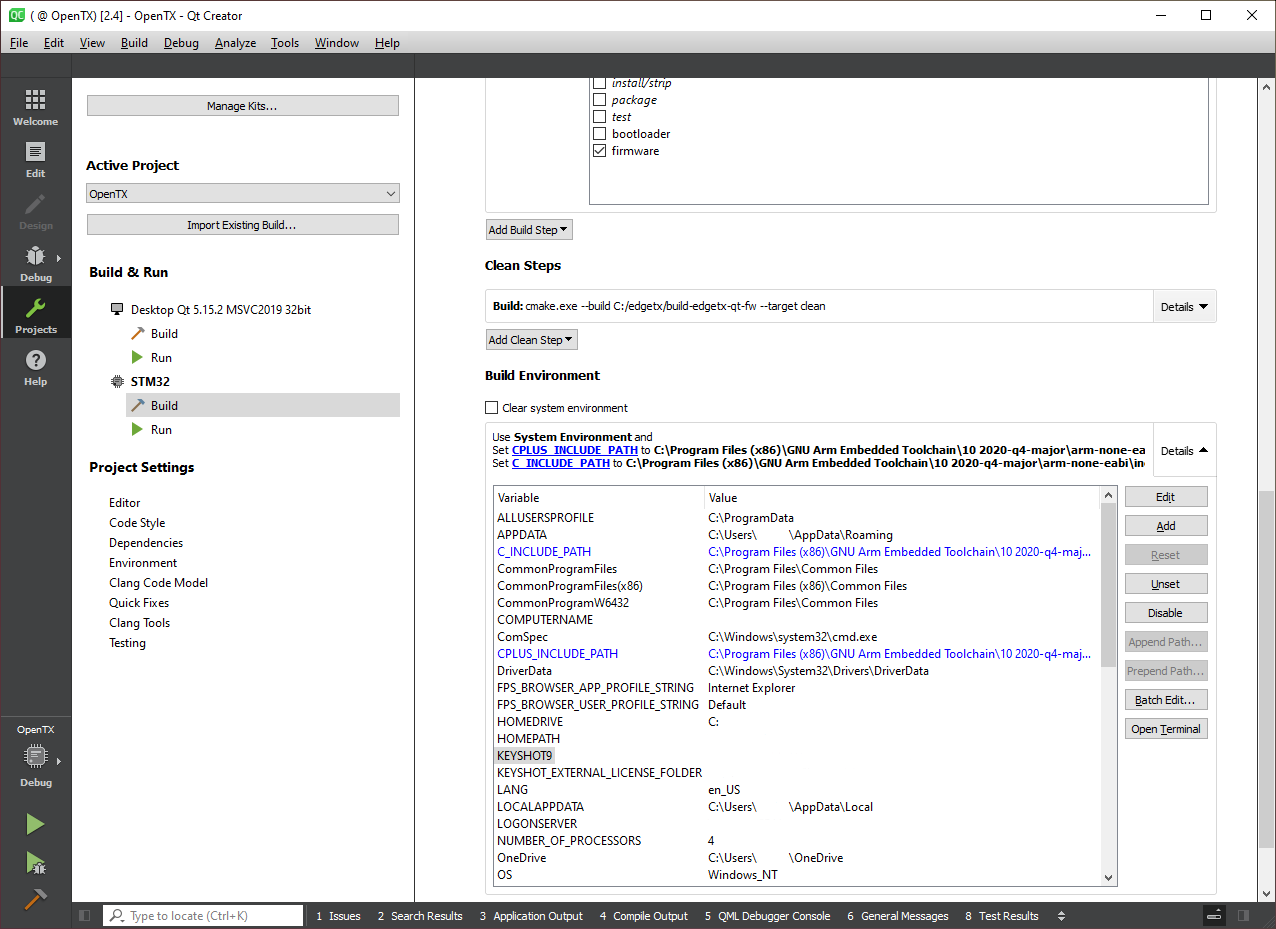
We need to add two environment variables. Under Build Environment click Details to the right of Use System Environment to unfold the variable list.
Click Add and give the variable a name C_INCLUDE_PATH with value C:\Program Files (x86)\GNU Arm Embedded Toolchain\10 2020-q4-major\arm-none-eabi\include
Click once more Add to add a second environment variable with a name CPLUS_INCLUDE_PATH and a bit longer value C:\Program Files (x86)\GNU Arm Embedded Toolchain\10 2020-q4-major\arm-none-eabi\include\c++\10.2.1;C:\Program Files (x86)\GNU Arm Embedded Toolchain\10 2020-q4-major\arm-none-eabi\include\c++\10.2.1\arm-none-eabi
Now, we should have everything set up. Let's set our deploy target by clicking in the bottom left of Qt Creator window the chip symbol with OpenTX and Debug labels. Choose STM32 as Kit and firmware (on STM32) as Run target:
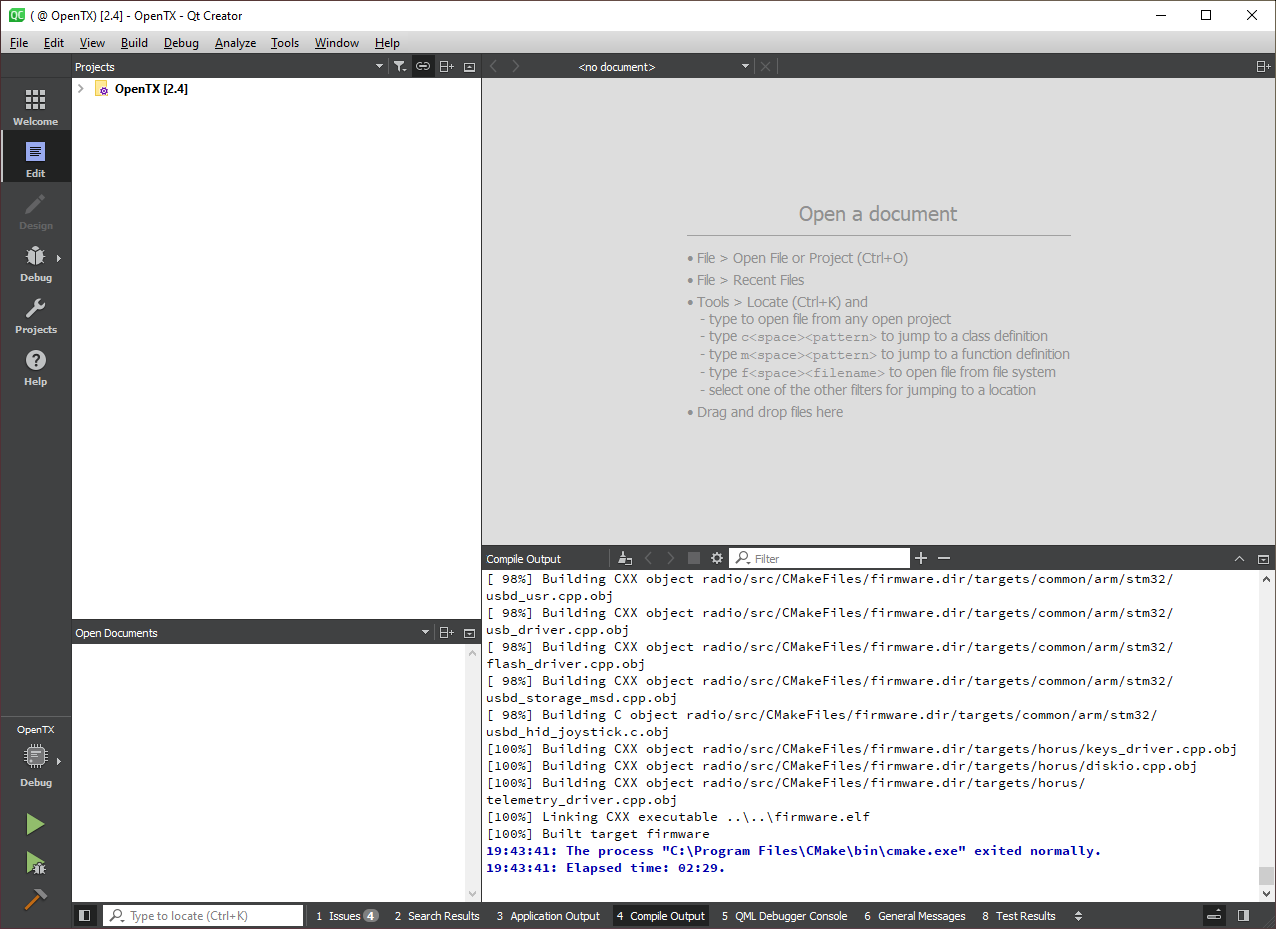
To test if building works, click the hammer icon (Build button) on lower left corner to build firmware. On the bottom of Qt Creator window, you can navigate to 4 Compile Output and click it to see compiler progress. After some minutes you should have firmware.bin and firmware.elf files built and saved in C:\edgetx\build-edgetx-qt-fw
To edit the source of EdgeTX, click in Mode Selector Edit. Unfold OpenTX [2.4] and open a source file you would like to edit under radio -> src -> firmware -> Source Files. Qt Creator offers many wide established features like syntax highlighting, code completion, refactoring, integrated version control and many more.
For deeper instructions into Qt Creator, please see Qt Creator Manual.
- You can find the code for radio firmware and libsimulator under
radio/src/firmware/Source Files(main entry point is inopentx.cpp). - Companion software is under
companion/src/companion/Source Files(main entry point is incompanion.cpp) - Simulator source code you find under
companion/src/simulator/Source Files(main entry point is insimulator.cpp)
Please note that Companion, Simulator and libsimulator should be built using the Desktop kit and not STM32 kit, as these will run on x86/x64 and not on ARM! Currently building radio simulator library does not yet work under Windows!
Getting started with Git
- Workflow for GitHub noobs
Building and debugging EdgeTX
- In a webbrowser with Gitpod
- Windows 10 (MSYS2)
- Docker with Windows 10
- Ubuntu in a WSL2 under Win10
- Ubuntu 20.04
- MacOS 10.15
- MacOS 14.1
Modifications:
- Flysky Hall Sticks Mod
- Flysky FRM303 Mod for TX16S
- Flysky PL18 & PL18EV Hardware Mod for Complete EdgeTX Support
- Flysky NB4+ Hardware Mod for Complete EdgeTX Support
- Flashing EdgeTX to Flysky PL18 or Paladin-EV
How to unbrick your radio with STM32CubeProgrammer
DMA mappings of radios:
- RadioMaster TX16S
- FlySky NV14
Interrupt usage of radios:
- RadioMaster TX16S
Implementation notes:
- YAML Parser/Generator
- Mixer synchronisation
Deprecated:
- Windows 10 (Visual C++)

