-
Notifications
You must be signed in to change notification settings - Fork 52
Guidelines for Peak Picking
-
Peak’s width and shape are two very crucial things to look at while classifying a peak as good or bad. Peak’s shape should have a Gaussian distribution and width should not be spread across a wide range of RT.
-
Peak Intensities for a group are plotted as bar plots for all the samples. These bar plots have heights relative to the other samples. Thus, for a good peak, the intensities should be high.

-
Intensity barplot heights should be higher for all the samples than Blank samples. We use intensities of Blank samples to set our group baseline. Blank intensities are used to calibrate intensity values across zero concentration.
-
A good peak should have standards with varying intensity in a particular fashion (increasing or decreasing).
-
Quality Control (QC) samples give us information about the quality of the data, i.e., it assesses reproducibility and software performance. Samples whose intensities and concentrations are already known are used as QCs to determine if the instrument is working as expected. Values (and scales) can be calibrated using QCs.
-
If peak groups of a particular metabolite are separated apart (not aligned well) then the user should use stringent alignment parameters to overcome this problem.
-
For a particular metabolite, let’s say, if it has n number of groups, then the group which is much closer to the above guidelines should be selected as a good peak. Multiple groups can also be selected in case of ambiguity (if Rt information is not provided).

- Gaussian shape
- Peak group with narrow RT and lying within a reasonable threshold
- Good sample intensities
- Low blank intensities
- QC samples show good peaks
- An observable trend in intensity bars of standards, as well as samples.
-
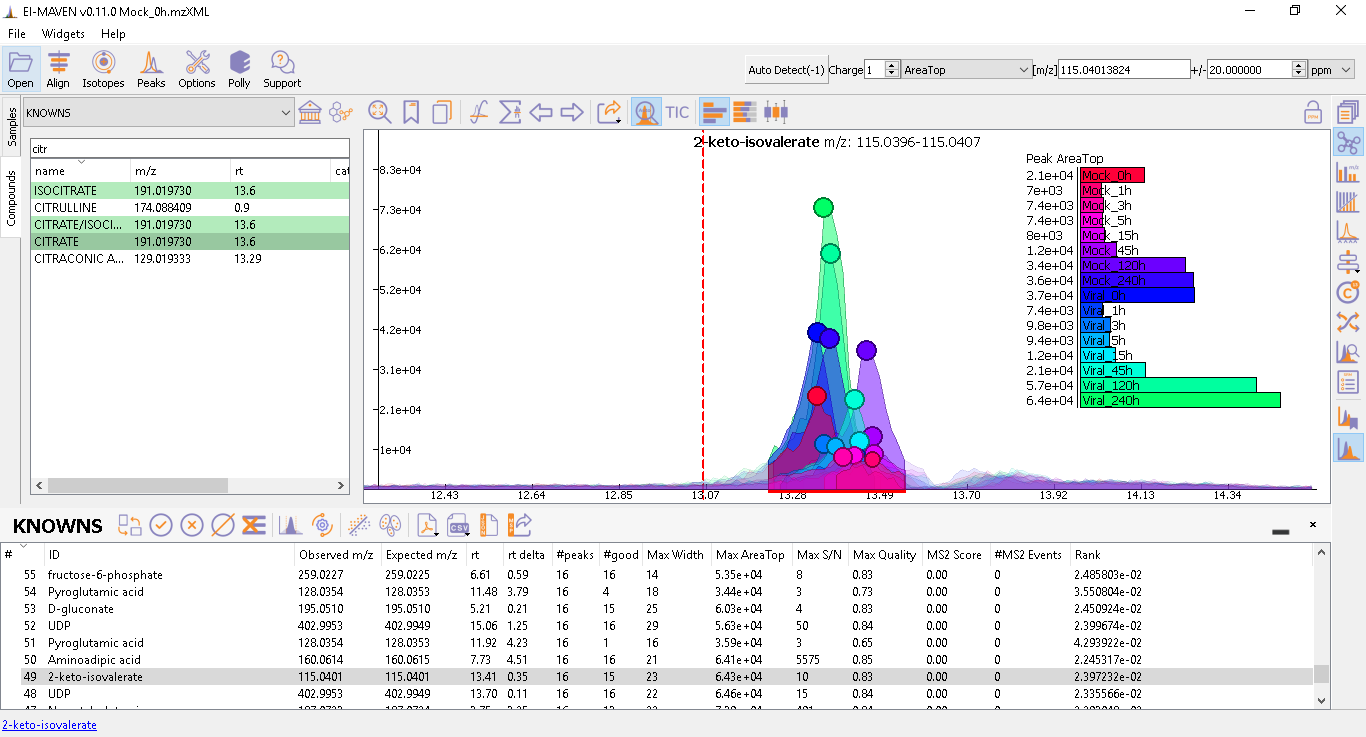
The peaks do not have a Gaussian shape. Low-intensity peaks are not grouping well. QC intensities (10^4) are too high wrt the low sample intensities (10^2), which are very close to the noise level.
-
The peaks have a good Gaussian shape. But the blank intensity bars are high. All the sample intensity bars are shorter or roughly equal to the blank intensities, implying the peaks are noisy. This should be marked as bad if better groups of the same metabolite are available.
-
The intensity levels are high. The blank intensities are lower. However, the peaks are spread over a long range of RTs, have poor grouping, and have a forward trailing peak. If the signal to noise ratio was improved, this peak would probably not be detected.
-
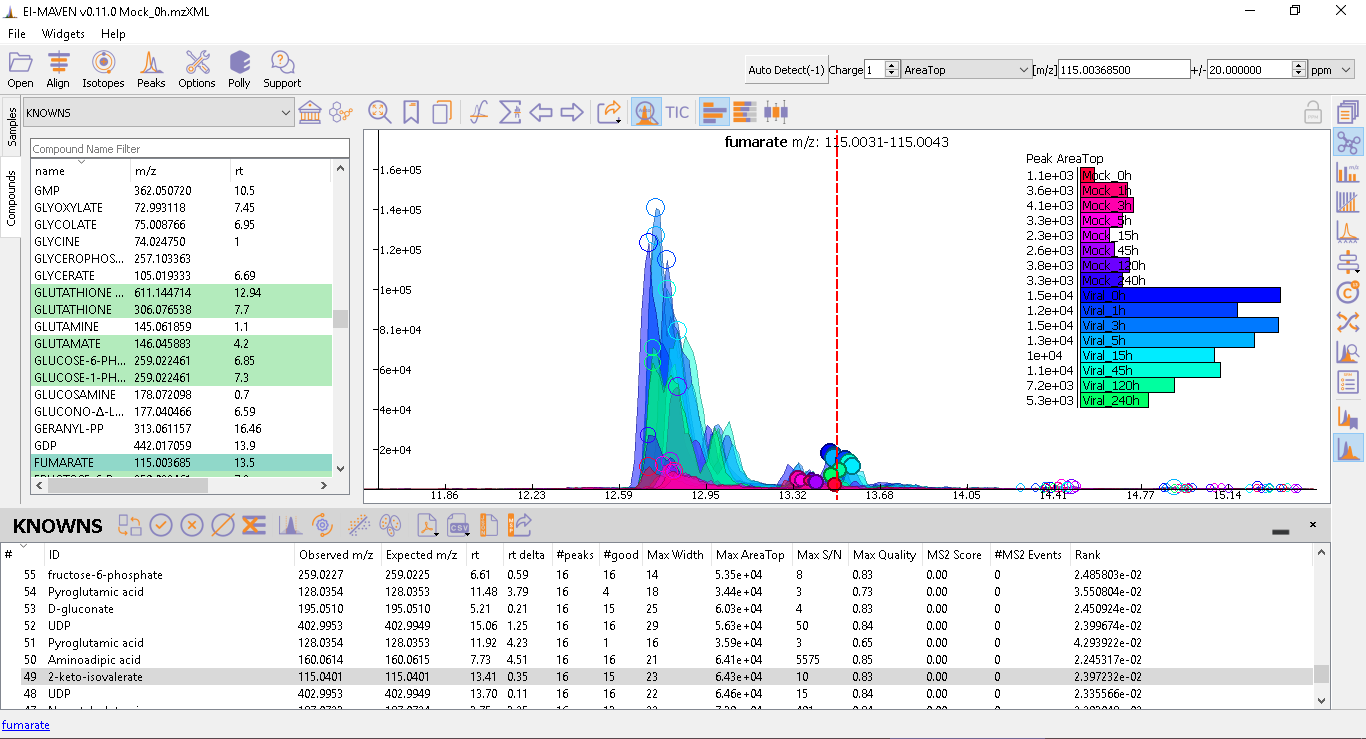
In the following image, many sample intensities are missing from the intensities bar plots. Peaks do not have a Gaussian shape, nor good grouping. These peaks are probably noise which has been wrongly annotated. The blank intensities are high as well.
-
This is a noisy group. There are no discrete peaks visible in the image. The X-axis is crowded with noise. The peak shape is sharp, triangular, or line-like; not Gaussian. The intensity levels are high, but so are noise levels.
Another example of a noisy peak:
-
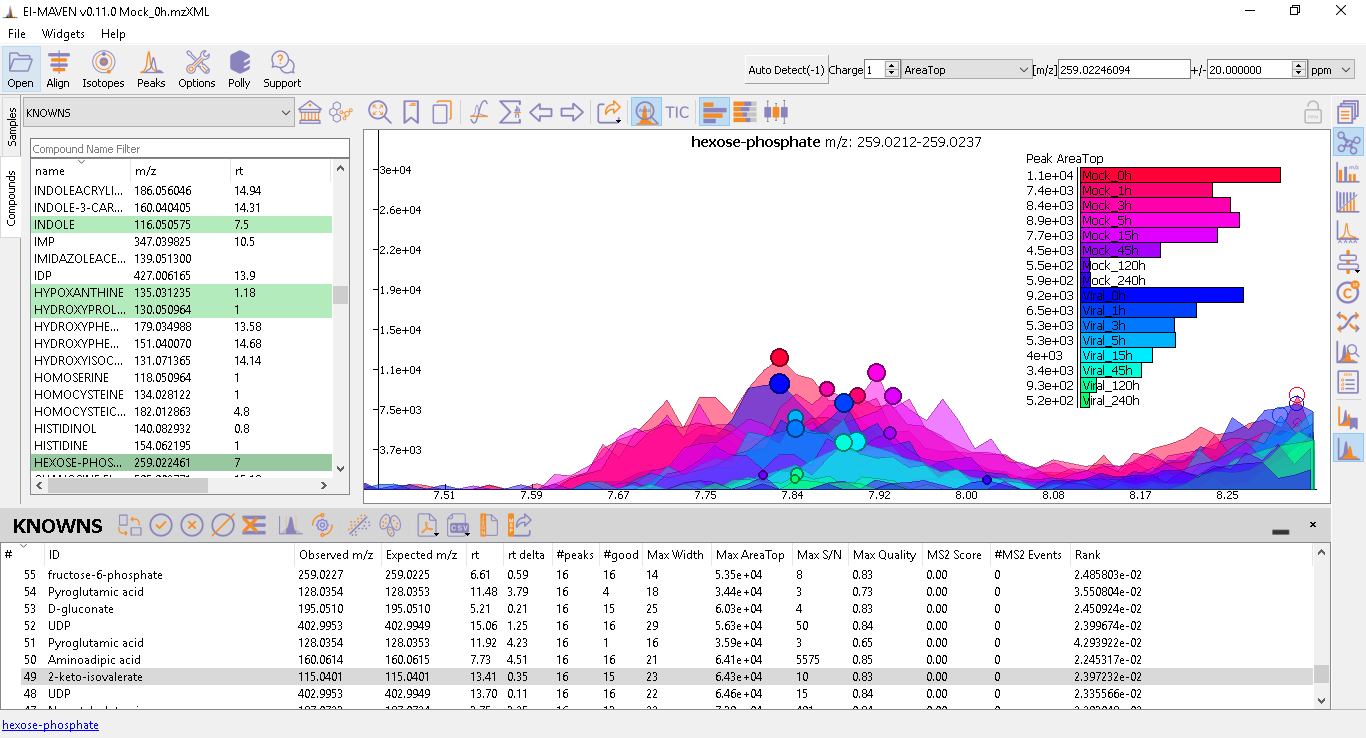
The peaks don’t have a Gaussian shape and are also noisy. The intensity values are very low.
-
For low-intensity groups like this, the peak characteristics can be determined by zooming in.
The mouse can be used to select the area of the peak as shown below. On zooming, it will be easy to make a decision on peak quality
NOTE: The user can mark any ambiguous peaks as good, and can review all such peaks later in the process.


