SmartRadL is a project which helps in understanding the different pavements and obstacles in those pavements by training the machine learning models on the data collected from the physics toolbox suite by riding on different locations.
- Objective
- Hardware
- Feature Labels
- Feature Maps
- Data Analysis
- Machine Learning Model Results
- Conclusion
Nowadays many people prefer to choose their bike as a mode of commutation to their office, university, etc. Although there are numerous improvements done towards the pathway for the bikes, still bikers are facing difficulties commutating in their bikes due to the road surface conditions. Also, not knowing the road surface of their planned routes makes it difficult to choose the suitable bikes for their commutation. In this project, we tried to monitor the conditions of the road surface by using machine learning algorithms to classify different pavements of the road like asphalt or cobblestone as well as obstacles found on different pavements of the road like manhole/potholes, kerbs, and speed bumps using the data obtained from the Physics Toolbox Suite Pro App by mounting the mobile phone onto the bike.
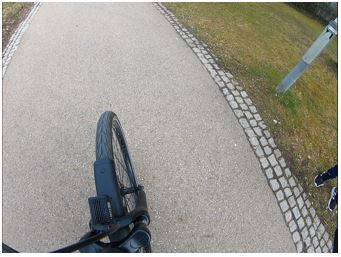
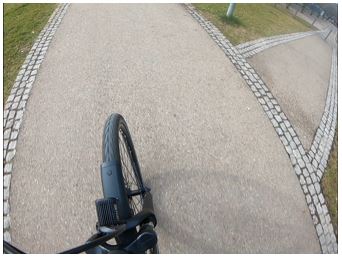
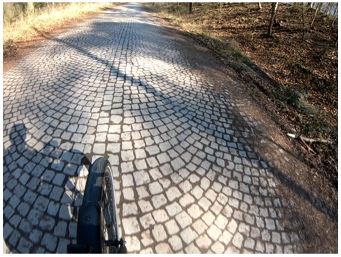
For collecting the data, we have chosen two riders biking a Scott Bosch e-bike, which is put in eco mode, in 7th gear, and with a tire pressure of 2 bar. Furthermore, we have used One Plus Nord, running on android 11, mounted on the stem of the handlebar of the bike, installed with the pro version of physics Toolbox Suite Pro App to record the three axes g-force, three-axis acceleration, three-axis gyroscope, azimuth, roll, pitch, GPS coordinates, and speed data with 100HZ. Finally, we have used GoPro Black 4 hero camera to record the video of the rides which are later used for labeling the features.
| Stop | Asphalt Ride |
|---|---|
 |
 |
| Cobblestone Ride | Asphalt Manhole |
|---|---|
 |
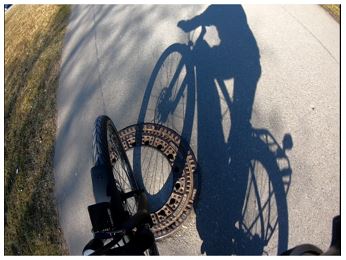 |
| Asphalt Kerb | Asphalt Bump |
|---|---|
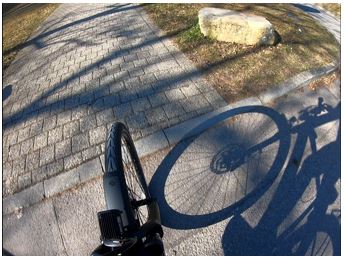 |
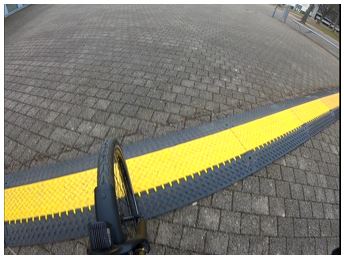 |
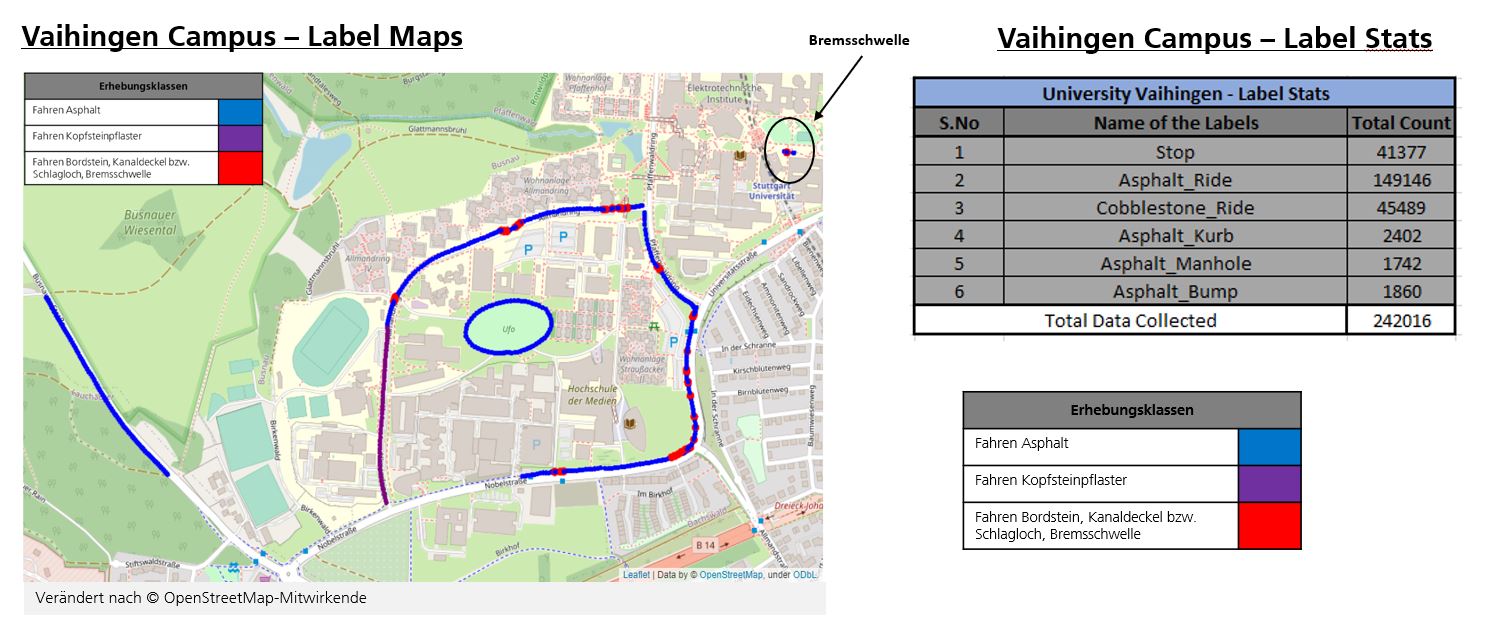
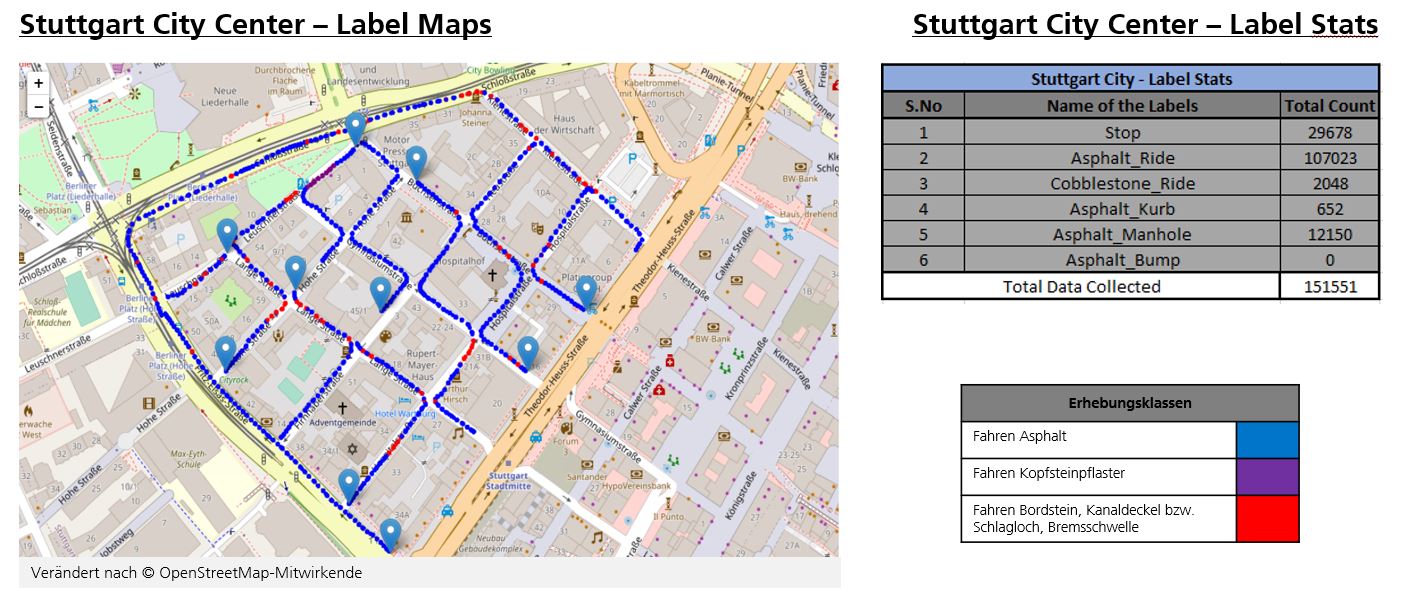
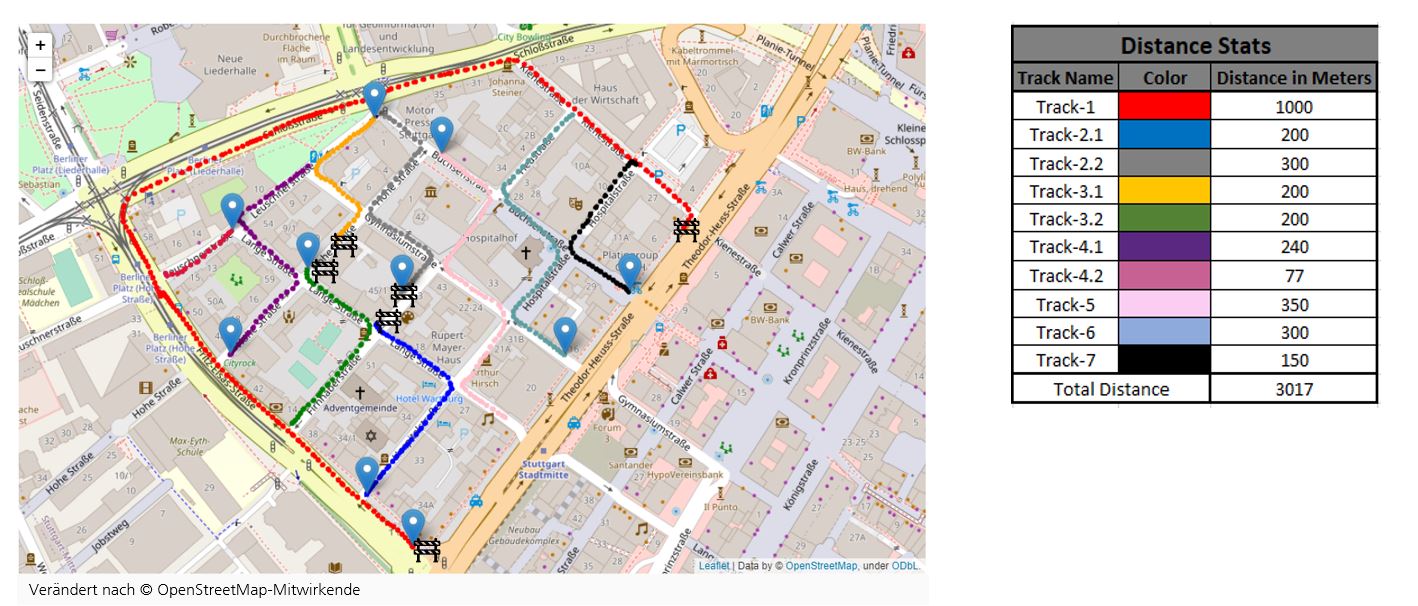
In this project, we have collected the above-mentioned features from two locations namely Vaihingen and Stuttgart, Germany. To illustrate the data collection from these locations, here we have created Visualization of maps program which provides information about the features location and statistics.
- Vaihingen Campus Map:
- Stuttgart City Center Map:
In order to train a machine learning algorithm to classify the different pavements and obstacles found on them, it is necessary to clean up the data, analyse the data, and convert the data beforehand.
- First of all, we have Combined the Datasets collected from two locations along with cleaning up the values with zero entities.
- Secondly, we have done Data Analysis on the data. we have divided acceleration signals into time windows to reduce the 100 Hz to 20 Hz. From the time windows applied, we have extraced total of 16 features from three channels namely mean, standard deviation, average absolute difference, minimum value, maximum value, maximum-minimum difference, median, median absolute deviation, interquartile range, negative count, positive count, values above mean, number of peaks, skewness, kurtosis, energy resulting in 48 feature columns. Along with these 48 feature columns, we have considered overall average resultant and overall signal magnitude area. So, in short total of 50 features are extracted from the acceleration signal using the time windows.
- Thirdly, we have used fourier series on the time windows to convert into frequency domain. From these frequency domain values, we have extraced total of 14 features namely FFT mean, FFT standard deviation, FFT average absolute difference, FFT minimum value, FFT maximum value, FFT maximum-minimum difference, FFT median, FFT median absolute deviation, FFT interquartile range, FFT values above mean, FFT number of peaks, FFT skewness, FFT kurtosis, FFT energy resulting in 42 feature columns. Along with these 42 feature columns, we have considered overall FFT average resultant and overall FFT signal magnitude area. So, in short total of 44 features are extracted from the acceleration signal.
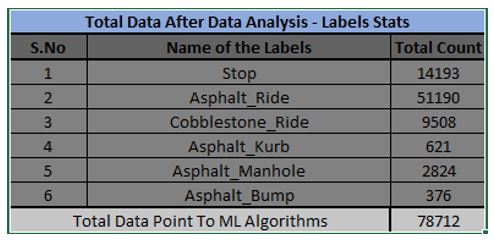
- Overall, a total of 102 feature columns are extracted and provided to the machine learning model. Also, the feature label statistics after the data analysis are displayed below.
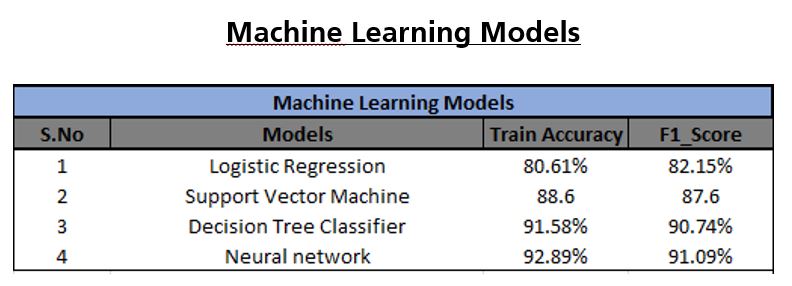
For this project, we have taken four machine learning models to classify the objectives namely Logistic Regression, Support Vector Machine, Decision Tree Classifier and Neural Network. The train accuracy and F1_score of the machine learning models are displayed below.
Furthermore, the machine learning models are saved along with the coefficients to predict the newly generated data.
