-
Notifications
You must be signed in to change notification settings - Fork 21
Home
![]()
Contents:
eddy4R is a family of open-source packages for eddy-covariance (EC) raw data processing, analyses and modeling in the R Language for Statistical Computing (R Core Team, 2016). As described in Metzger et al. (2017), eddy4R is being developed by NEON scientists with wide input from the scientific community, example studies that use eddy4R include (see references) for full citation:
- De Roo et al., 2014;
- Kohnert et al., 2015;
- Lee et al., 2015;
- Metzger et al., 2012;
- Metzger et al., 2013;
- Metzger et al., 2016;
- Sachs et al., 2014;
- Salmon et al., 2015;
- Serafimovich et al., 2013;
- Starkenburg et al., 2016;
- Vaughan et al., 2015;
- Xu et al., 2017.
eddy4R currently consists of the two public packages eddy4R.base and eddy4R.qaqc, with several additional packages in preparation (including eddy4R.stor, eddy4R.turb, eddy4R.ucrt and eddy4R.erf). The current two packages are published here in conjunction with NEON’s release of EC Level 1 data products, and are available in the eddy4R public repo.

Figure 1. Visual representation of eddies carrying carbon dioxide exchanged between the earth's surface and atmosphere
A current challenge for EC tower networks in informing regional and continental scale processes is instrument and computational compatibility. The computations involved in EC processing are complex and developmentally dynamic, making code portability, extensibility, and documentation paramount. The suite of eddy4R packages is used to process eddy-covariance data, i.e. calculate the net surface-atmosphere exchange (animated depiction below) by combining turbulent exchange and storage exchange estimates. For a comprehensive description of the the theory and algorithms used in NEON eddy covariance data processing, see the bundled eddy covariance composite ATBD

Figure 2. Animation showing a flux tower measuring the storage and turbulent exchange of carbon dioxide and combining these estimates to determine the net surface-atmosphere exchange of a control volume

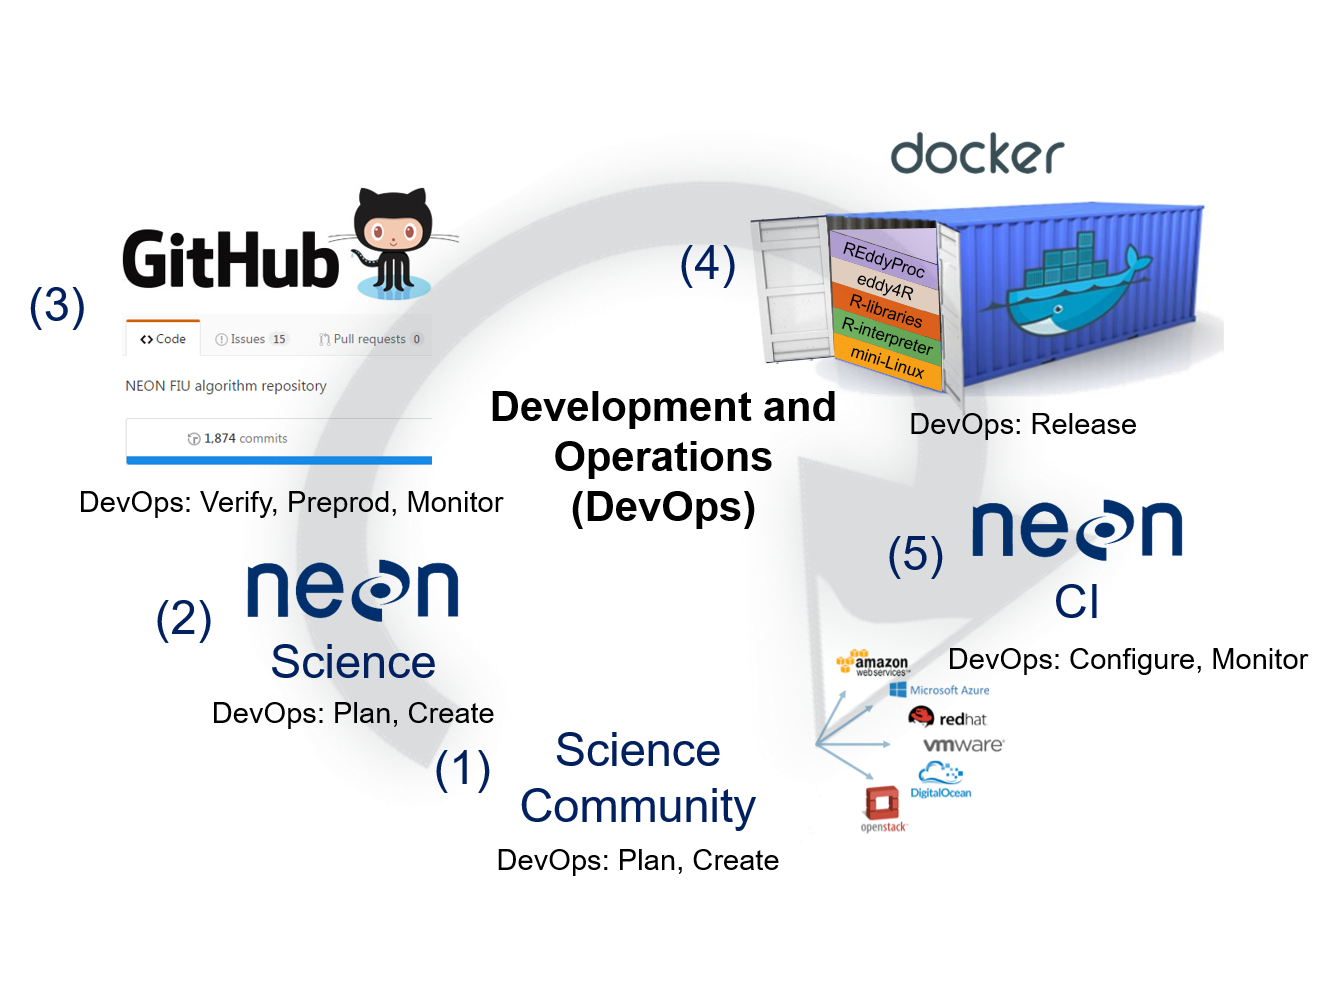
Figure 3. Shows a NEON-specific DevOps workflow. Detailed description of each DevOps stage is outlined below.
The NEON DevOps approach is briefly described as follows. See Metzger et al. (2017) for full documentation.
NEON’s DevOps framework consists of a periodic sequence that incorporates these workflow steps. For this purpose we define NEON Science as personnel working directly on the NEON project, and the Science Community, regardless of whether they also work on the NEON project, as anyone producing or using data, algorithms, or research products related to the NEON data themes (Atmosphere; Biogeochemistry; Ecohydrology; Land Cover and Processes; Organisms, Populations, and Communities): the science community contributes algorithms and best practices
(1). Implicitly or explicitly, this embodies the DevOps: Plan stage – the algorithms most valued by the community are being incorporated. Together with NEON Science
(2), these algorithms are coded in the open-source R computational environment (DevOps: Create stage). DevOps: Verify (testing) and Package (packaging) are performed as the code is compiled into eddy4R packages via the GitHub distributed version control system
(3). NEON Science releases an eddy4R version from GitHub, which automatically builds an eddy4R-Docker image on DockerHub as specified in a “Dockerfile”
(4; DevOps: Release stage). The eddy4R-Docker image is immediately available for deployment by NEON CI
(5; DevOps: Configure & Monitor stages), the Science Community (1) and NEON Science (2) alike. Here the DevOps: Configure (computational resource allocation) & Monitor stages occur. Monitoring of end-user experience is also performed in GitHub (3) via issue-tracking.

Figure 4 . Describes how a DevOps cycle is realized in Github.
This is a short FAQ that will grow as we receive feedback from the user community.
-
Q: What are some of the advanced features of eddy4R in Docker containers not currently available in other flux processors?
- A: eddy4R in Docker containers…
- …performs alignment and motion compensation for wind measurements.
- …equally processes eddy-covariance data from stationary towers or moving platforms (aircraft, buoys etc.) while keeping track of position and changing source areas.
- …provides time-frequency decomposed fluxes. This allows e.g. order-of-magnitude improved temporal and spatial resolution, unveiling of organized turbulent transport modes and more.
- …allows inferring multi-dimensional environmental response functions. These permit calculating land-cover specific fluxes, rectification of spatial representativeness and more.
- …performs regionalization at fundamentally improved space/time resolution compared to other approaches, allowing to investigate diel cycle and even sub-hourly changes.
- A: eddy4R in Docker containers…
-
Q: What are the advantages of NEON deploying eddy4R in Docker containers compared to other flux processing schemes, such as e.g. ICOS, AmeriFlux etc.?
- A: eddy4R in Docker containers…
- …is fully automated: It is designed to require human interaction only per notification, mostly in case of hardware issues. This is made possible through NEON’s tight integration of hardware and software development, which starts from the ground up from high-frequency data, which is not currently available at ICOS or AmeriFlux.
- …is computationally efficient: It uses a fully adaptive single-pass workflow, which makes it computationally efficient compared to other flux processing schemes. This approach permits near-real-time processing, for which AmeriFlux and NASA have already expressed interest.
- …is scalable across large computing facilities: It is fully parallelized.
- …development and use is actively conducted by the research community, and consolidated at NEON.
- …maximizes up-time and data coverage through tight integration with troubleshooting and data quality monitoring as part of NEON Problem Tracking and Resolution procedures.
- …combines existing off-the-shelf solutions in a most modular way This modularity permits straightforward adjustments and versioning to the code base as science and/or hardware progresses.
- …provides a modular blueprint of the necessary framework for deploying other community-developed algorithms as part of the NEON data processing pipeline. Examples for expected synergies and efficiencies are the generation of higher-level data products including gap-filling, flux maps etc.
- A: eddy4R in Docker containers…
-
Q: Why is NEON using eddy4R to process eddy-covariance data?
- A: eddy4R Metzger et al. (2017)…
- …is an existing off-the-shelf solution like EddyPro, TK3, EddyUH, EdiRe and others. The main difference is that eddy4R is not pre-compiled, and consists of open-source modules that can be modified and combined to user-defined workflows as needed. Mauder and Clement are contributing to eddy4R, among others.
- …provides the necessary flexibility to efficiently mold an eddy-covariance software into the NEON Cyberinfrastructure, Data Products and Problem Tracking and Resolution framework.
- …calculates storage flux from tower profiles, which is not handled by all other flux processors.
- …produces fluxes that fulfil requirements ensuring critical NEON science questions can be addressed. Standard configurations of pre-compiled software do not allow for the flexibility of a interactive code base, which can be adapted to each project's specific set of requirements. eddy4R is intended to address the more advanced use cases that require user interfacing during raw data processing.
- …has been verified to within 1% against TK3, and EddyPro has expressed interest in several eddy4R modules.
- A: eddy4R Metzger et al. (2017)…
De Roo, F., Abdul Huq, S. U., Metzger, S., Desai, A. R., Xu, K., and Mauder, M.: On the benefit of driving large-eddy simulation with spatially resolved surface fluxes derived from environmental response functions, in: TERENO International Conference, 29 September–2 October 2014, Bonn, Germany, 2014.
Kohnert, K., Serafimovich, A., Metzger, S., Hartman, J., and Sachs,T.: Geogenic sources strongly contribute to the Mackenzie River Delta’s methane emissions derived from airborne flux data, in: 48th AGU annual Fall Meeting, 14–18 December 2015, San Francisco, USA, 2015.
Lee, J., Vaughan, A., Lewis, A., Shaw, M., Purvis, R., Carlslaw, D., Hewitt, C., Misztal, P., Metzger, S., Beevers, S., Goldstein, A., Karl, T., and Davison, D.: Spatially resolved emissions of NOx and VOCs and comparison to inventories, in: 48th AGU annual Fall Meeting, 14–18 December 2015, San Francisco, USA, 2015.
Metzger, S., Junkermann, W., Mauder, M., Beyrich, F., ButterbachBahl, K., Schmid, H. P., and Foken, T.: Eddy-covariance flux measurements with a weight-shift microlight aircraft, Atmos. Meas. Tech., 5, 1699–1717, https://doi.org/10.5194/amt-5-1699- 2012, 2012.
Metzger, S., Junkermann, W., Mauder, M., Butterbach-Bahl, K., Trancón y Widemann, B., Neidl, F., Schäfer, K., Wieneke, S., Zheng, X. H., Schmid, H. P., and Foken, T.: Spatially explicit regionalization of airborne flux measurements using environmental response functions, Biogeosciences, 10, 2193–2217, https://doi.org/10.5194/bg-10-2193-2013, 2013.
Metzger, S., Burba, G., Burns, S. P., Blanken, P. D., Li, J., Luo, H., and Zulueta, R. C.: Optimization of an enclosed gas analyzer sampling system for measuring eddy covariance fluxes of H2O and CO2, Atmos. Meas. Tech., 9, 1341–1359, https://doi.org/10.5194/amt-9-1341-2016, 2016.
Sachs, T., Serafimovich, A., Metzger, S., Kohnert, K., and Hartmann, J.: Low permafrost methane emissions from arctic airborne flux measurements, in: 47th AGU annual Fall Meeting, 15–19 December 2014, San Francisco, USA, 2014.
Salmon, O., Caulton, D., Shepson, P., Brian, S., Metzger, S., and Musinsky, J.: Attributing airborne measurements of forest CO2 exchange to finer spatial scales, in: 5th NACP Principal Investigators Meeting, 26–29 January 2015, Washington, D.C., USA, 2015.
Serafimovich, A., Metzger, S., Kohnert, K., Hartmann, J., and Sachs, T.: The airborne measurements of methane fluxes (AIRMETH) arctic campaign, in: 46th AGU annual Fall Meeting, 9–13 December 2013, San Francisco, USA, 2013.
Starkenburg, D., Metzger, S., Fochesatto, G. J., Alfieri, J. G., Gens, R., Prakash, A., and Cristóbal, J.: Assessment of de-spiking methods for turbulence data in micrometeorology, J. Atmos. Ocean. Tech., 33, 2001–2013, https://doi.org/10.1175/jtech-d15-0154.1, 2016.
Vaughan, A. R., Lee, J., Misztal, P., Metzger, S., Shaw, M. D., Lewis, A. C., Purvis, R., Carslaw, D., Goldstein, A., Hewitt, C. N., Davison, B., Beevers, S. D., and Karl, T.: Spatially resolved flux measurements of NOx from London suggest significantly higher emissions than predicted by inventories, Faraday Discuss., 189, 455–472, https://doi.org/10.1039/c5fd00170f, 2016.
Xu, K., Metzger, S., and Desai, A. R.: Upscaling tower-observed turbulent exchange at fine spatio-temporal resolution using environmental response functions, Agr. Forest Meteorol., 232, 10–22, https://doi.org/10.1016/j.agrformet.2016.07.019, 2017.
To inquire with repository maintainers on questions or ideas that fall outside the Github Issue Tracker workflow, please contact us @ [email protected]

The National Ecological Observatory Network is a project solely funded by the National Science Foundation and managed under cooperative agreement by Battelle. Any opinions, findings, and conclusions or recommendations expressed in this material are those of the author(s) and do not necessarily reflect the views of the National Science Foundation.
GNU AFFERO GENERAL PUBLIC LICENSE Version 3, 19 November 2007
Information and documents contained within this repository are available as-is. Codes or documents, or their use, may not be supported or maintained under any program or service and may not be compatible with data currently available from the NEON Data Portal.