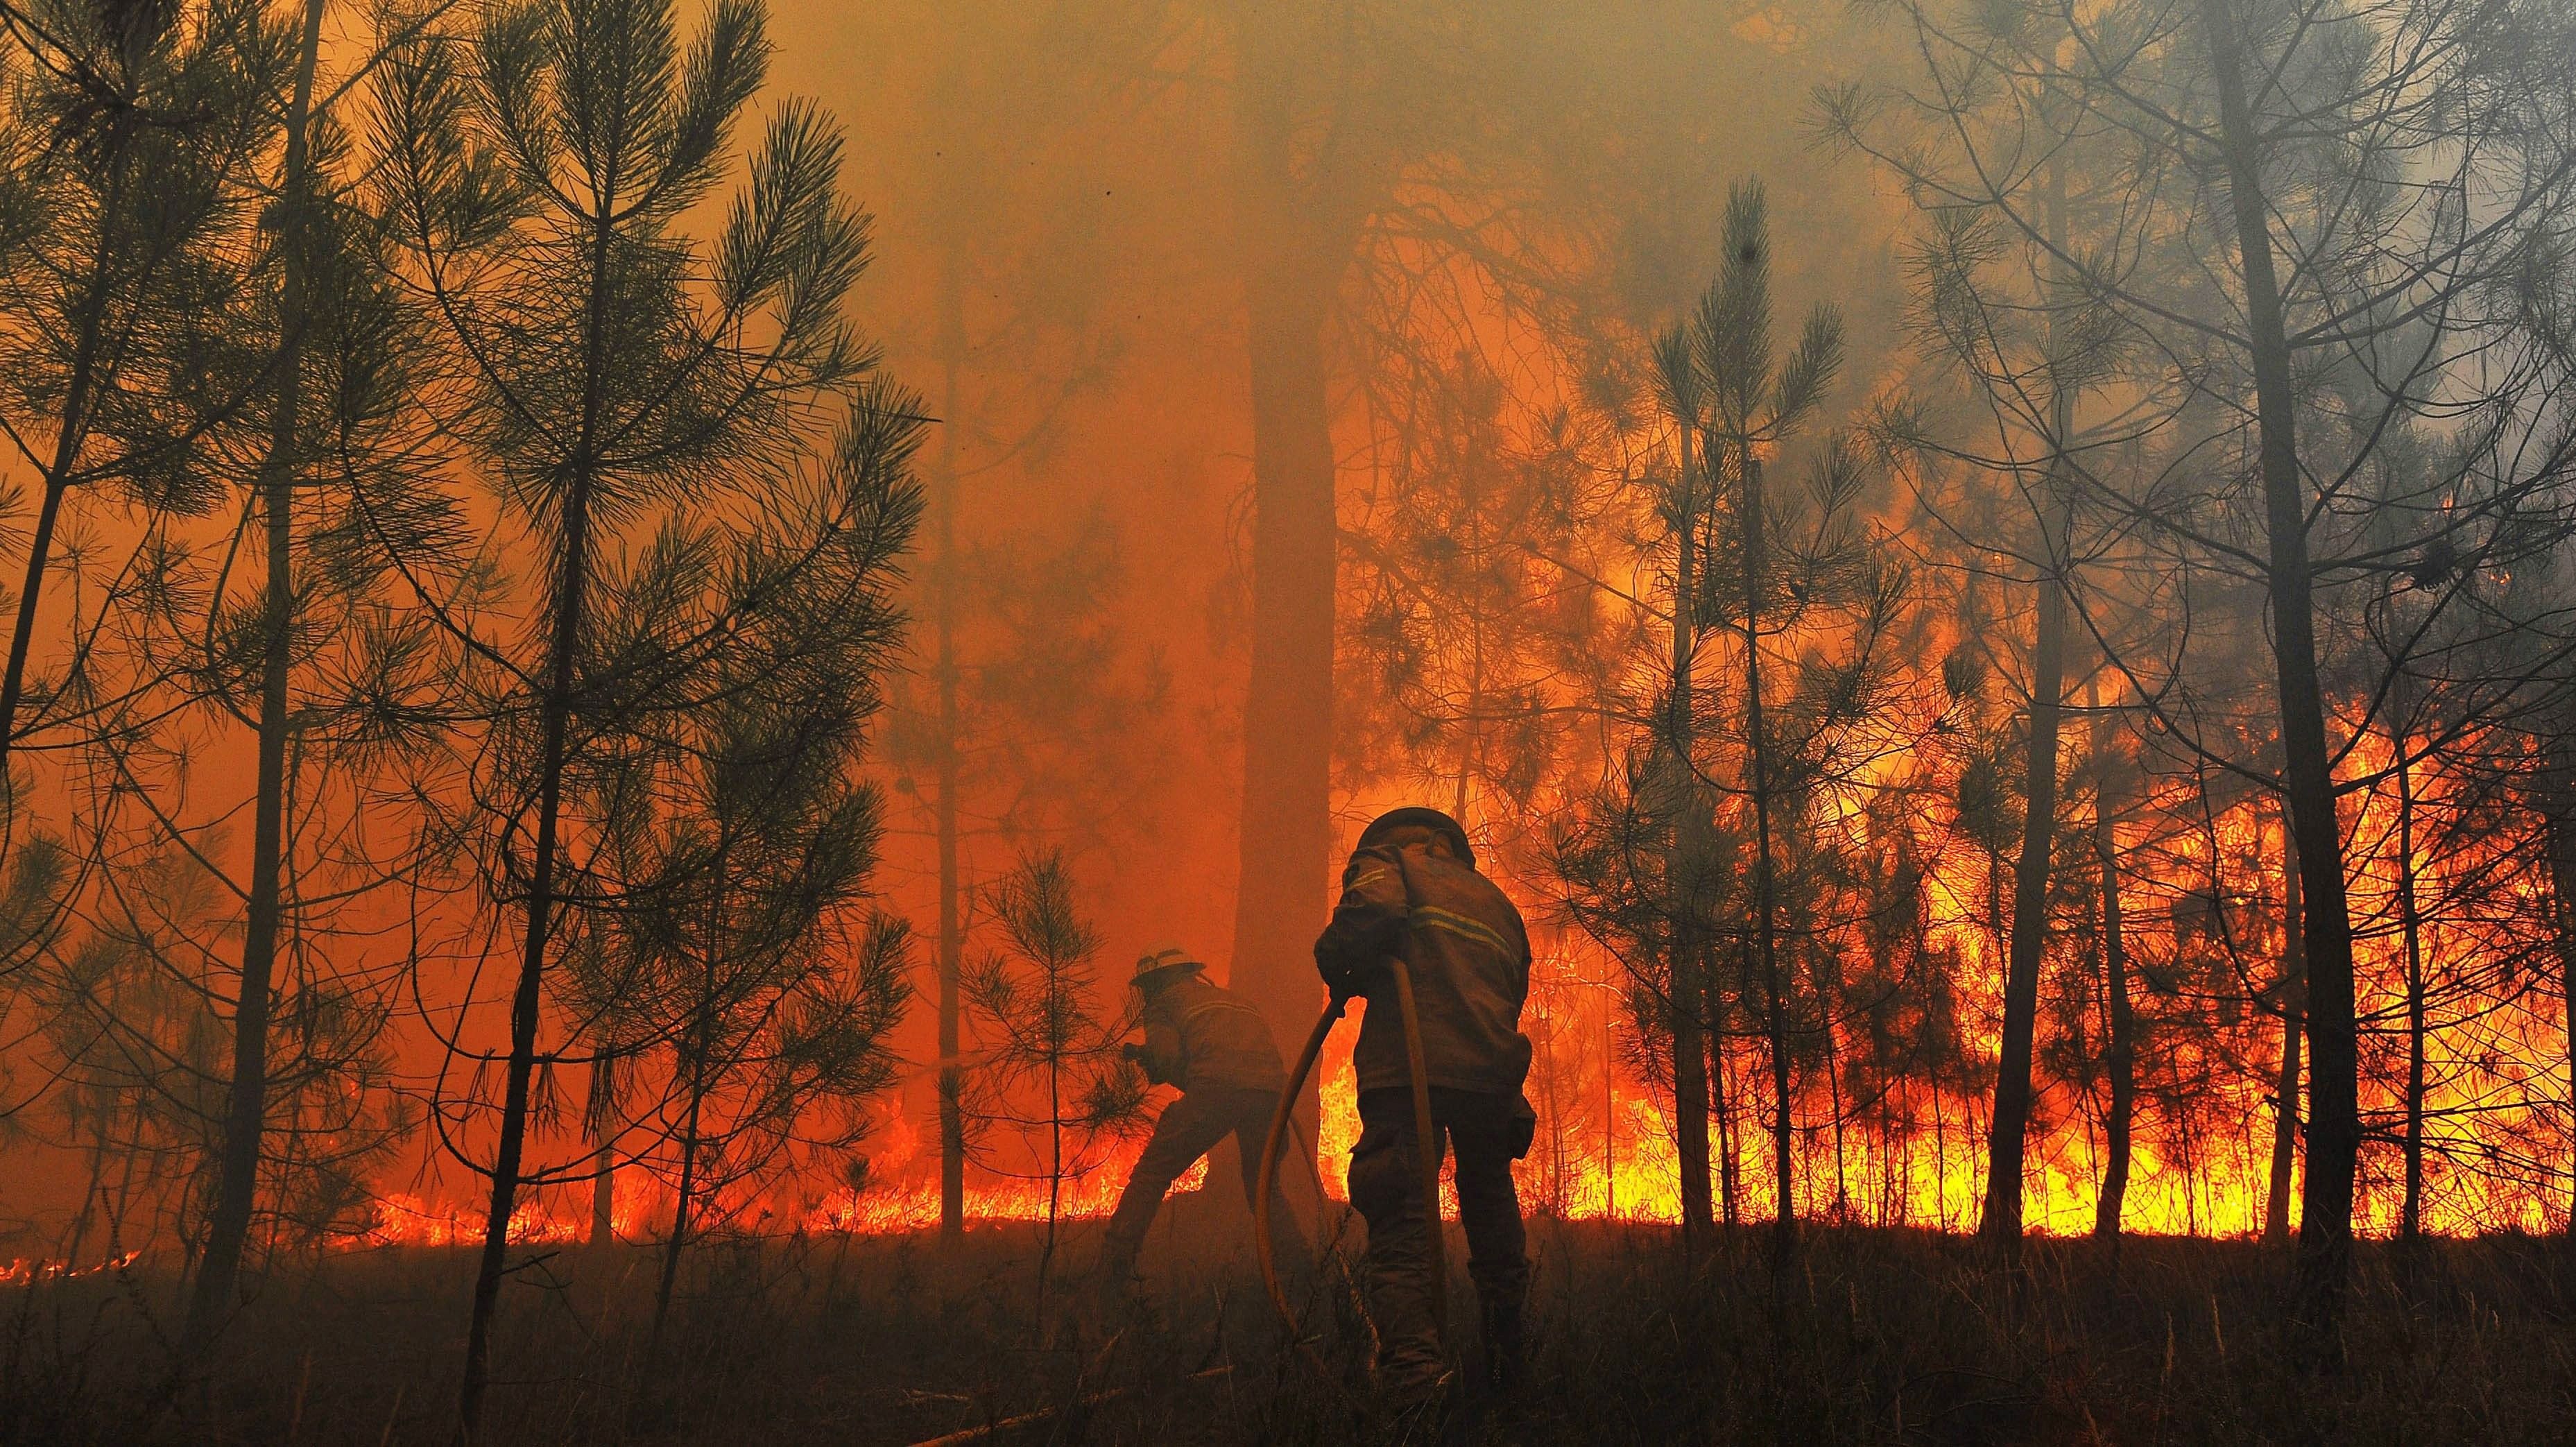
In Portugal, every year we have a problem with fires. Most of the time it's due either to poor resource allocation, or insufficient resources. I try to understand if it's possible to create a model to predict with acceptable accuracy the burnt area. In the process of cleaning and studying the dataset, I found many interesting things that are explained in the presentation. Feel free to use everything on this repository for your projects.
I will develop this continuously and feed it with new data.
Tableau public: Link
During my analysis, I found that an assessment by burnt area was a possible metric but probably not the best, so I calculated the CO2 emissions by district and used it as a metric to define the worst offender districts considering CO2 emissions. During the hypothesis, I learned that the re-ignition rates in these 5 districts are way higher than Portugal's re-ignition mean, but the average fire count is lower in the top 5.
Also very alarming is the level of certain types of fires in specific counties, where we can see that targeted actions must be pursued, and in some cases where the low level of investigative capability is also very disconcerting, like Ponte de Lima and Albergaria as shown in the next 2 plots.
Arcos de Valedevez is a bad case of intentional fires (RED) and re-ignitions (GREEN) showing a bad resource allocation and a big criminal portion of the fire.
Macedo de Cavaleiros is a very worrying case of negligence (YELLOW)
I was able to build fairly usable models with random forest tree regressors and extended tree regressors. For a better analysis, each district should have its model because the GPS coordinates are used in the model and it's not recommended to mix them, increasing model building time. I also included pickling capabilities so a model after computation can be unpacked and reused fast, a unpacking function is also included.
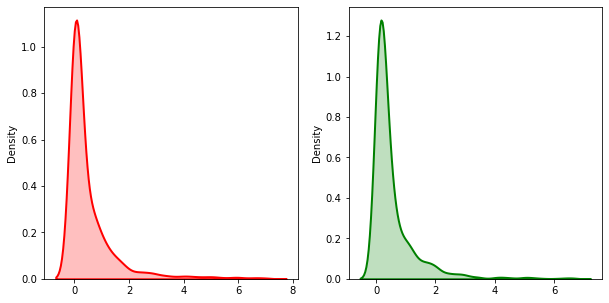
Original data in RED, model results in GREEN
• lat: Latitude
• lon: Longitude
• duration: Duration of fire in hours
• areal_total: Total Area burned ( Our target )
• alert_date: Date of the alert, we are going to transform it to the day of the year and drop it.
• relative_humitity: Relative humitity
• wind_intensity: Wind Intensity
• precipitation: Precipitation
• ffmc: The Fine Fuel Moisture Code, range 0-99
• dmc: The Duff Moisture Code, range 0-350
• dc: The Drought Code, range 0-1200
• isi: The Initial Spread Index
• avg_altitude: Average altitude
• avg_inclination: Average inclination ( correlated with easy access to the fire )
• rvdendity: Specific internal variable
• cosn5variety: Specific internal variable
-
Models, this folder contains the regression results and is defined as a target to save computed models. They are not included because of GitHub size restrictions.
-
NEW_DATA, this folder contains the raw fires data.
-
Presentation, conclusions of the fire analysis in a PowerPoint presentation, all graphs inside their respective folder.
-
Research, all useful research papers that I had to research.
- 01 -Main dataset manipulation. ipynb - This Jupiter notebook cleans our data to the best possible and valid shape so we can treat them on tableau or another app, after the process everything is saved to a CSV and an MYSQL database for further use.
- 02 - Modeling Data. ipynb - In this notebook, I import the relevant columns from the MySQL database, treat, scale, and make models. It's recommended to make individual models for each district, during my process of analysis I used the top 5 CO2 offenders to test and score the models. To change districts just change the where clause on the SQL query.
'''query = select lat, lon,duration, area_total, alert_date,relative_humidity,wind_intensity,precipitation, ffmc,
        dc,isi,dmc,avg_altitude,avg_inclination,rvdendity,cosn5variety
        from
        fires_clean
where district in ('Viana do Castelo', 'Viseu', 'Bragança', 'Guarda', 'Vila Real')'''- 03 - Hypothesis Formulation. ipynb - This notebook has my main question hypothesis calculations and means duration safe ranges for Portugal and the top 5 CO2 offender districts.
- Nuzulul Khairu Nissa, The Experiment of Forest Fires Prediction using Deep Learning -https://medium.com/mlearning-ai/the-experiment-of-forest-fires-prediction-using-deep-learning-d537e8c8e3a2
- Fire Weather Index (FWI) System - https://www.nwcg.gov/publications/pms437/cffdrs/fire-weather-index-system
- Jorge Miguel Gomes, A repository for ICNF data - https://github.com/vostpt/ICNF_DATA
- Paulo Cortez & Anibal Morais, A Data Mining Approach to Predict Forest Fires using Meteorological Data
- Joana da Fonseca Valente, Modelação do fogo florestal e os seus impactes na qualidade do ar.
Disclaimer: Academic project only, not for media use. Use the data freely.

