Introduction:
In this article, we delve into the intricacies of setting up a Continuous Integration and Continuous Deployment (CI/CD) pipeline for a Fast API Python application. This pipeline exemplifies the integration of various tools and platforms to automate and streamline the development and deployment processes.
Section: Pipeline Overview
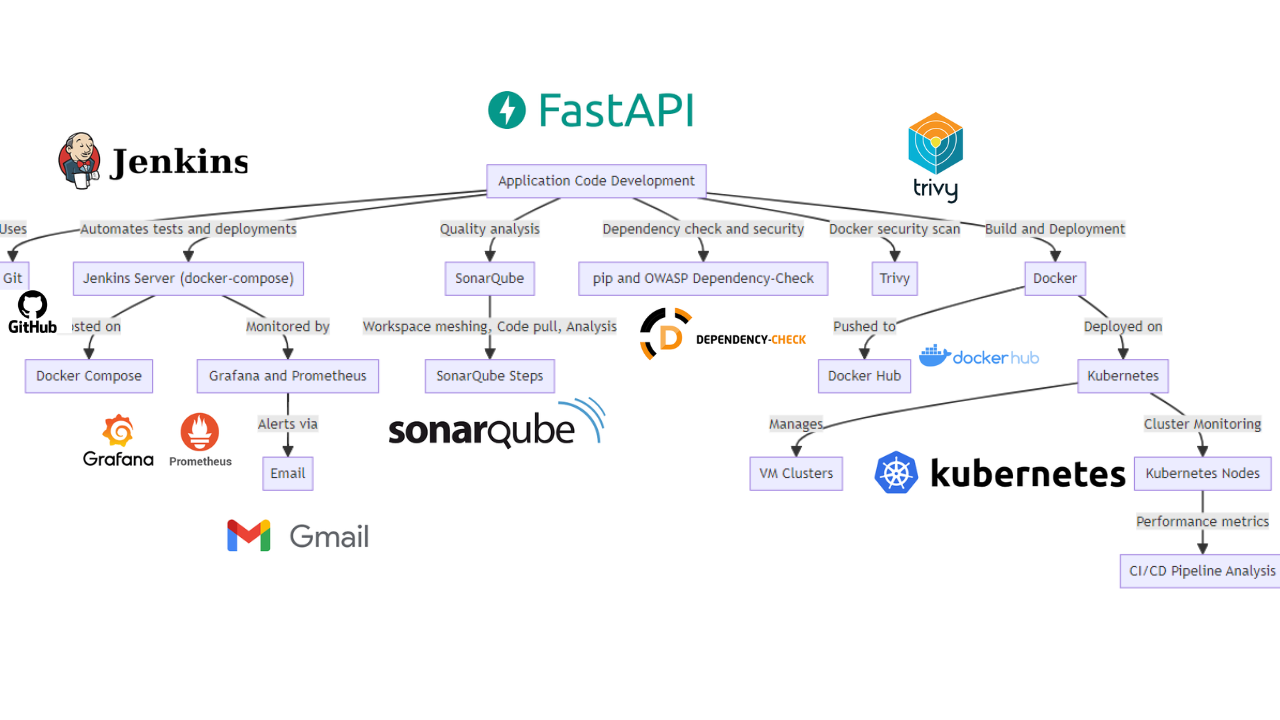
This pipeline is an example of a continuous integration and deployment (CI/CD) process using various tools and platforms. Here are the steps shown in the image:
Development of Application Codes:
The application code is developed and maintained in a version control system like Git.
Jenkins Server (docker-compose on Host Machine):
Jenkins, an integration server, automates code testing and deployments. It can be hosted on docker-compose. Jenkins can integrate with tools like Grafana and Prometheus for monitoring, with capabilities for sending email alerts if issues are detected.
Code Analysis with SonarQube:
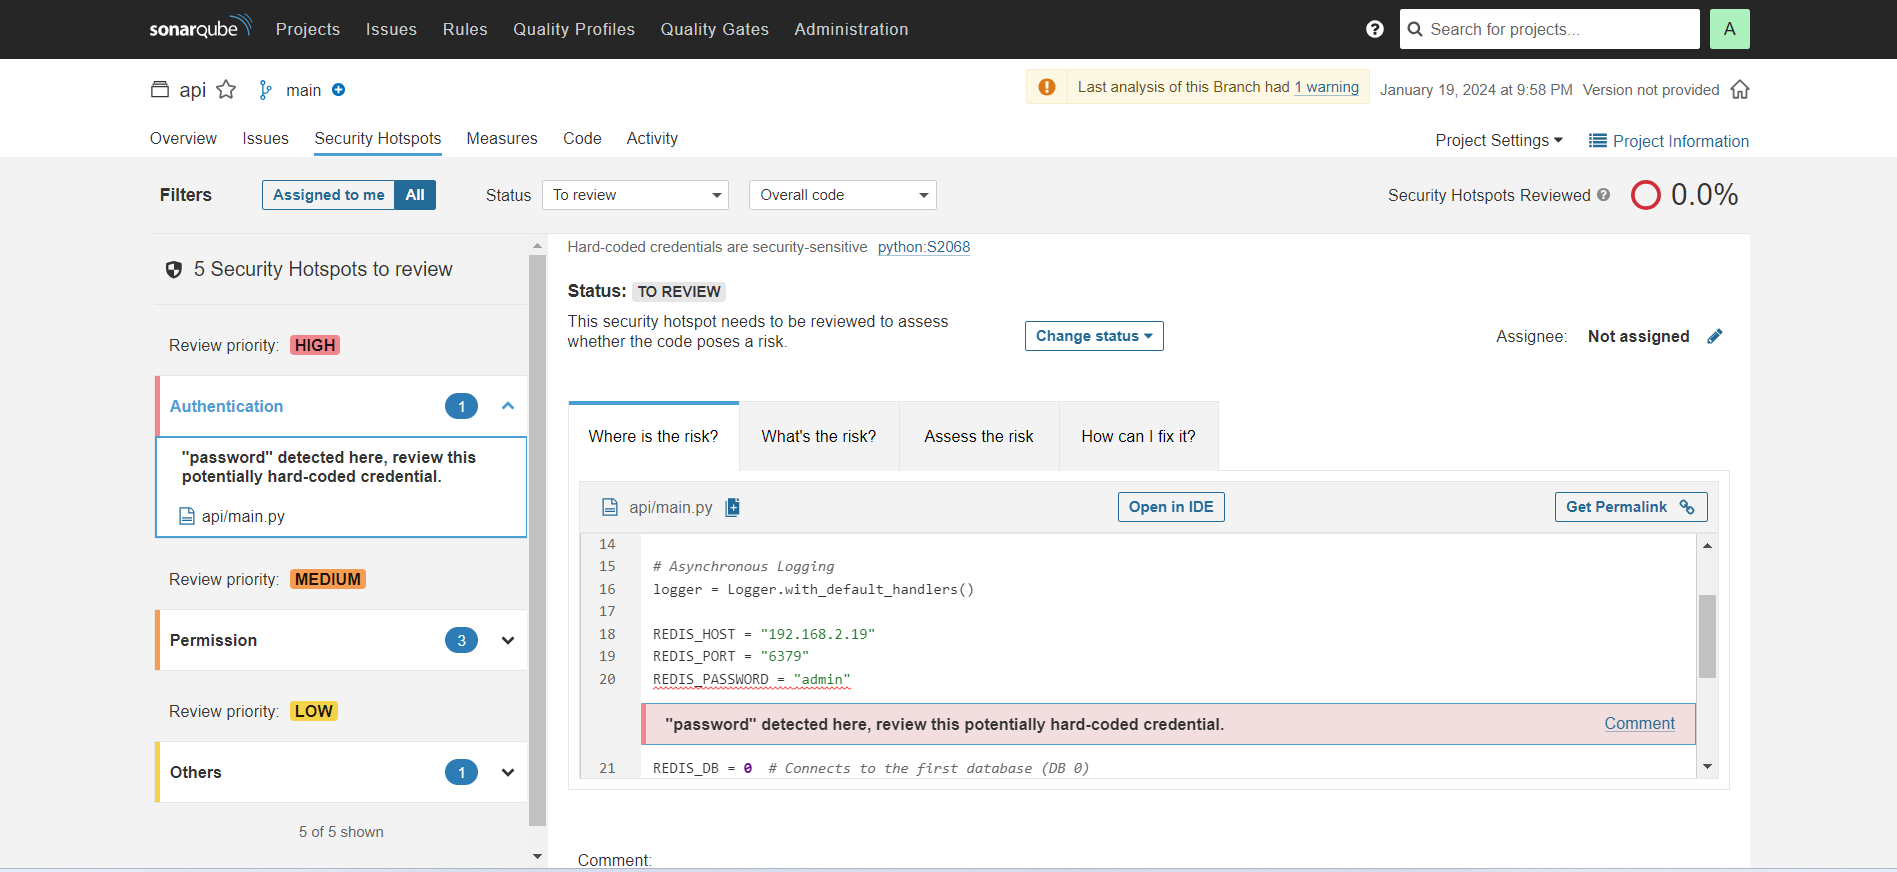
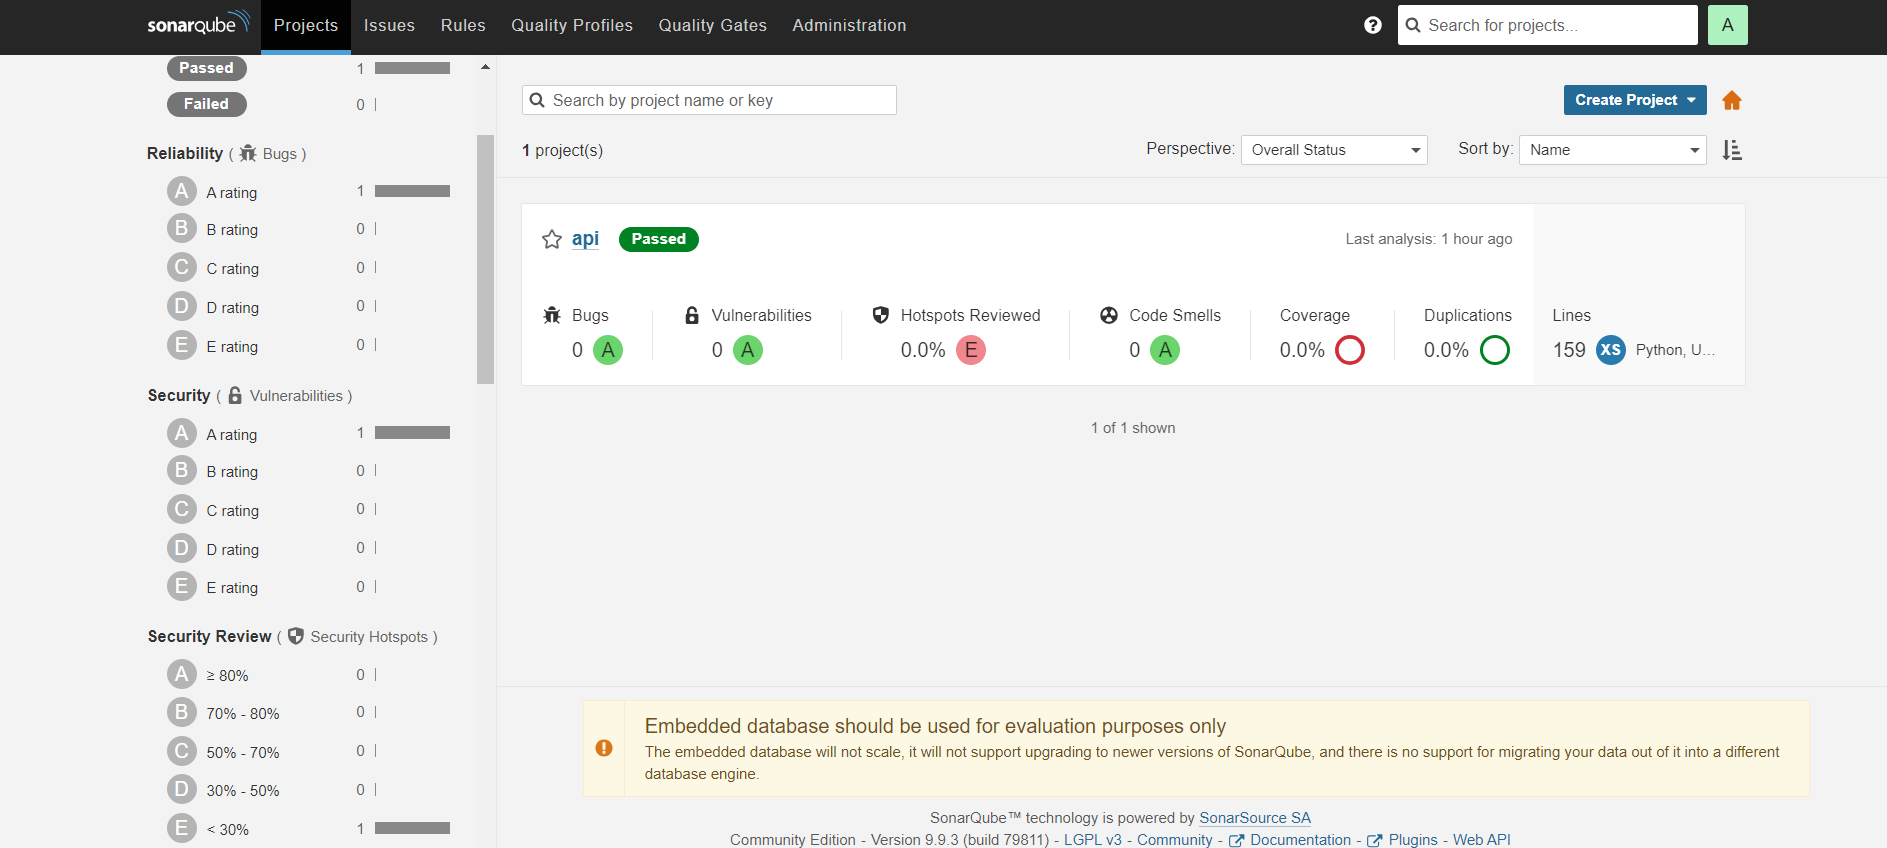
SonarQube is utilized for code quality analysis to identify bugs, vulnerabilities, and code smells.
Steps include setting up the workspace, pulling the code from Git, and analyzing it with SonarQube.
Checking Dependencies and Security:
Dependencies are installed, often using a package manager like pip. A dependency check is performed using tools like OWASP Dependency-Check to identify known vulnerabilities. Security scanning of Docker images is carried out using Trivy, a vulnerability scanner.
Construction and Deployment:
A Docker image containing the application code is built. The image is then stored on Docker Hub. Deployment involves deploying the Docker image into a container for execution. Kubernetes, a container orchestration platform, is often used for deployment, managing clusters of virtual machines or deployed containers.
Monitoring Kubernetes Clusters:
Kubernetes Master Nodes and Worker Nodes are monitored to ensure efficient deployment.
Performance metrics for each stage of the pipeline are tracked, aiding in the identification of bottlenecks and the enhancement of the CI/CD process.
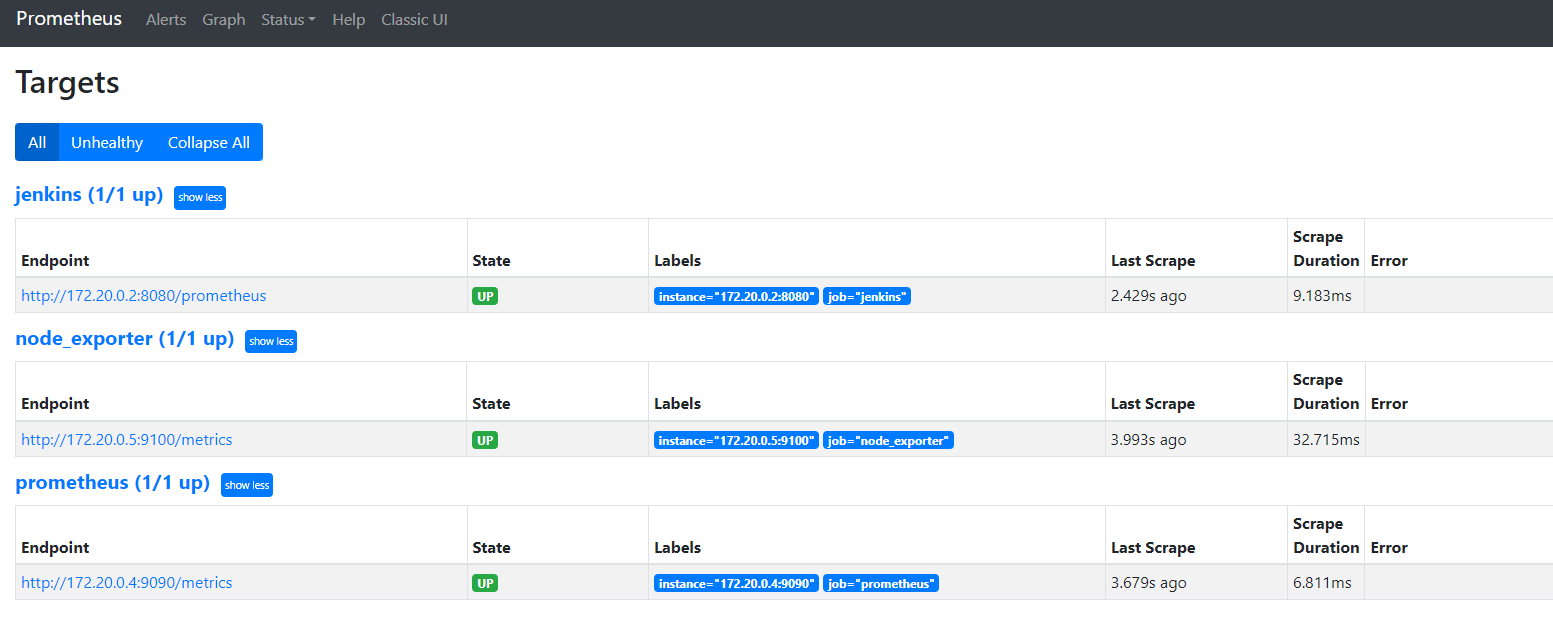
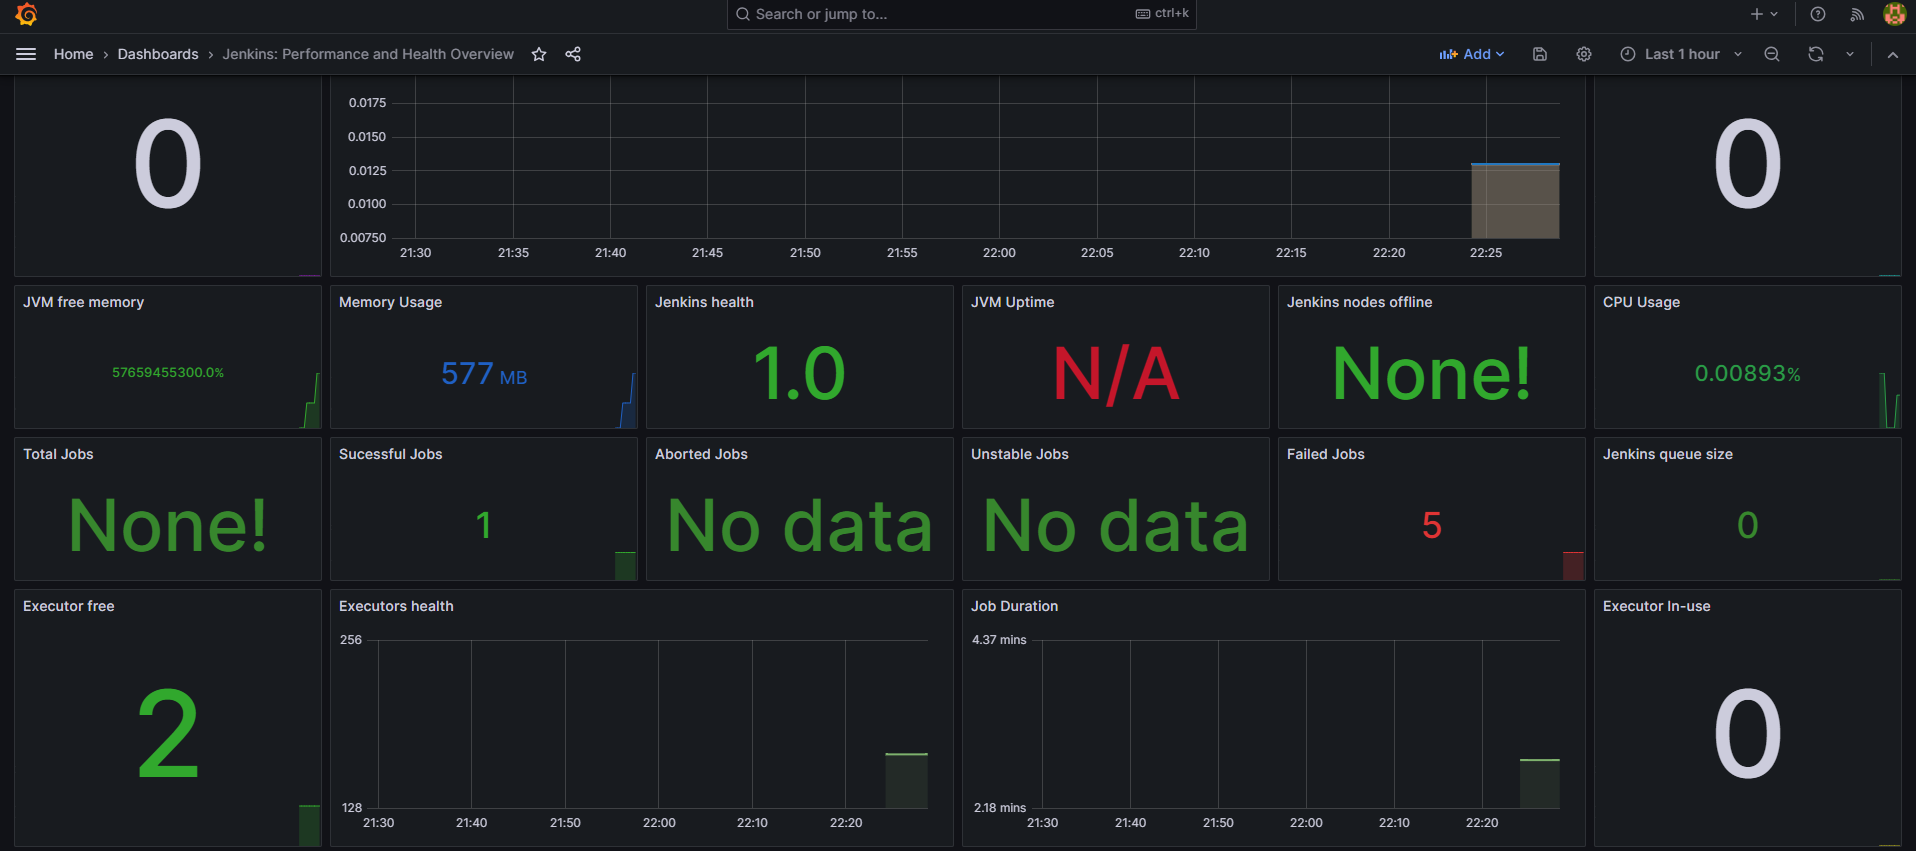
Prometheus and Grafana:
- Clone the Repository: Begin by cloning the repository from GitHub:
- git clone https://github.com/Stefen-Taime/build_api_devops_pipeline cd build_api_devops_pipeline
- Start the Services: Launch the services using Docker Compose:
- docker-compose up --build
-
Navigate to Kubernetes Directory: Go to the k8/kind directory.
-
Install Kubernetes with Kind:
-
Download the Kind binary:
-
curl -Lo ./kind https://kind.sigs.k8s.io/dl/v0.11.1/kind-linux-amd64
-
Make it executable:
-
chmod +x ./kind
-
Move it to a system directory:
-
sudo mv ./kind /usr/local/bin/kind
- Configure the Kubernetes Cluster:
-
Update the .yaml file with your host machine's IP address, which can be obtained via ifconfig.
-
Create a Kubernetes cluster with two nodes (one master and one worker):
-
kind create cluster --config kind-cluster-config.yaml
- Verify the Cluster:
-
Check the pods:
-
kubectl get pods
-
Check the nodes:
-
kubectl get nodes -o wide
-
To delete the cluster, use:
-
kind delete cluster
-
Access Jenkins: Go to Jenkins on localhost:8080 and complete the initial setup (install default plugins, set up an admin user).
-
Install Required Plugins: Install the following plugins:
-
Prometheus
-
Email Extension Template
-
SonarQube Scanner
-
nodejs
-
docker-workflow
-
kubernetes
-
docker-commons
-
docker-pipeline
-
docker-api
-
docker-build-step
-
kubernetes-credentials
-
kubernetes-client-api
-
kubernetes-cli
-
kubernetes-credential-provider
-
owasp-dependency-check
-
Restart Jenkins: Apply the changes by restarting Jenkins.
-
Configure Credentials: Create four credentials as shown in :
-
Docker credentials (ID: docker) with your DockerHub email and password.
-
Mail credentials (ID: mail) with your Gmail address and an app password obtained from Gmail security settings.
-
SonarQube token (ID: sonar-token). Generate this by creating a project on SonarQube, setting a webhook to http://172.20.0.2:8080/sonarqube-webhook, and creating a user token starting with sqp_.
-
Kubernetes config file (ID: kubeconfig-file). Use your kubeconfig file or the output of cat ~/.kube/config on your host machine.
-
Jenkins Tool Configuration: Add installations for JDK, Node.js, Docker, Dependency-Check, and SonarQube Scanner (version 4.8.1).
-
Configure Environment Variables: In Jenkins system settings, add an environment variable sonar-server with the URL http://172.20.0.3:9000 and use the sonar-token.
-
Email Notification Setup:
-
Set SMTP server to smtp.gmail.com, port to 465, default content type to HTML.
-
In advanced settings, enable SMTP authentication with your Gmail credentials and SSL protocol.
-
Create a Jenkins Pipeline: Create a new pipeline item and configure it using the Jenkinsfile. Ensure to modify it with your Docker username and SonarQube token.
-
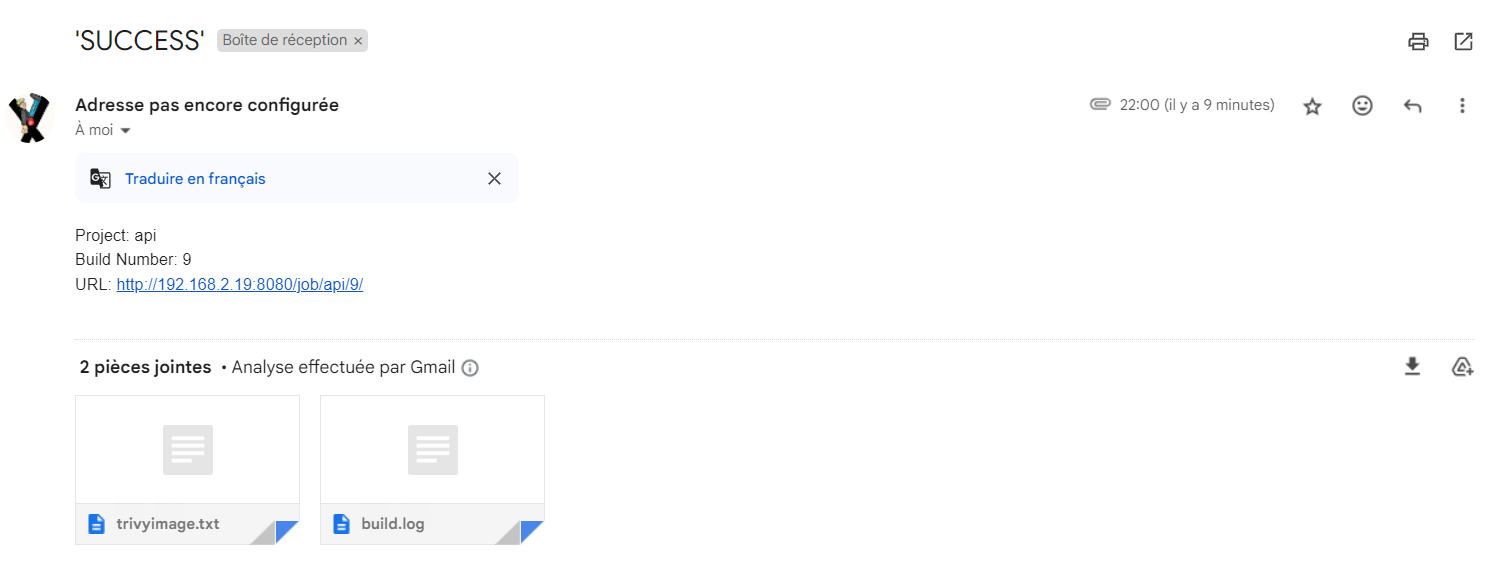
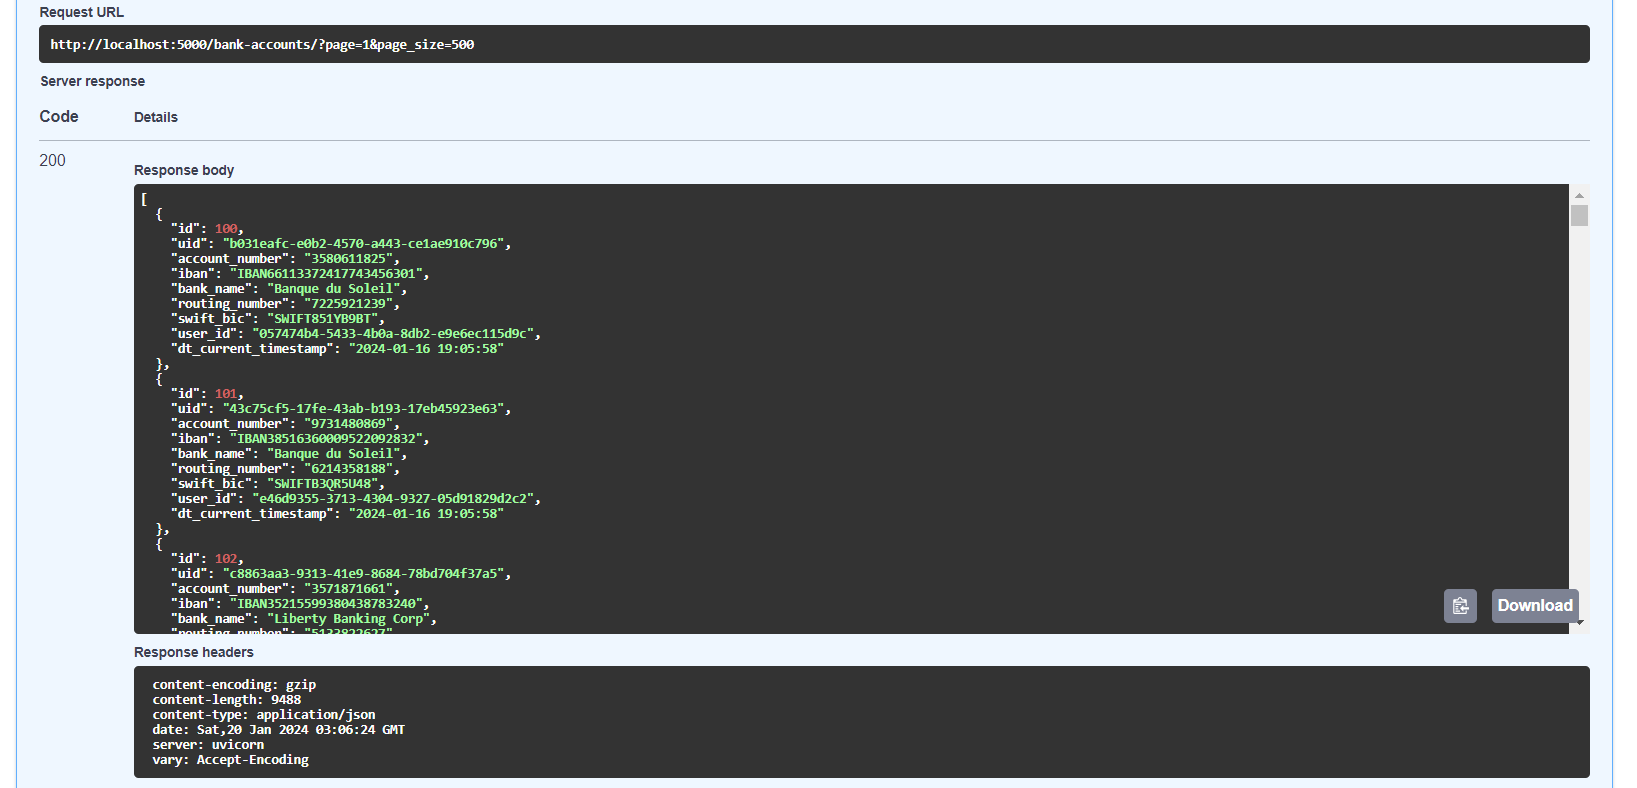
Deploy and Test: After a successful build, you should receive an email notification. For API testing, execute:
- kubectl port-forward pod/api-devops-68bf7cf4f6-45l8p 5000:8000
-
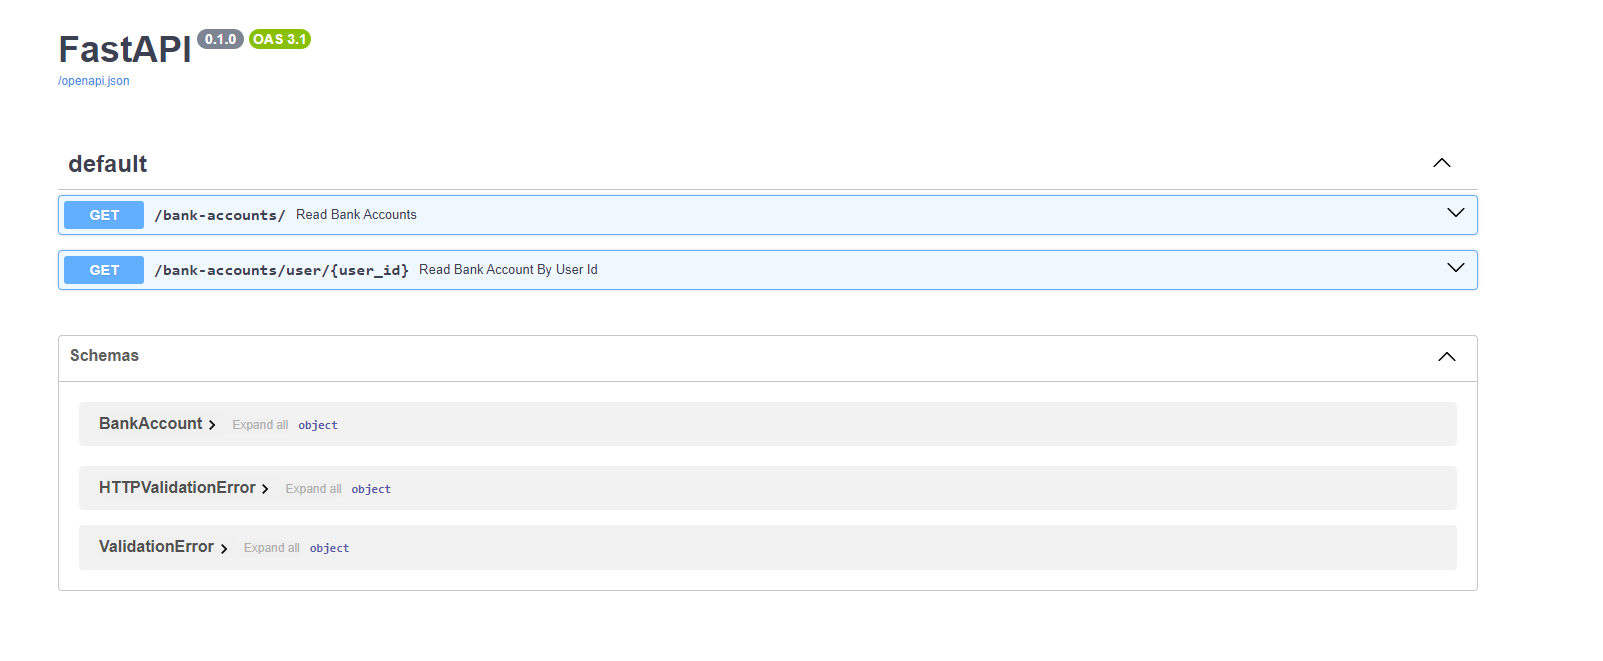
Then, navigate to localhost:5000/docs to access the FastAPI endpoints.
-
Monitoring with Grafana: Access Grafana on localhost:3000, add Prometheus (http://172.20.0.4:9090) as a data source, and import dashboard ID 9964 from Grafana Dashboard.
