How fucked are you? This is a tool to help you give a fuck, in order to get less fucked.
I'm a creative type who builds things for fun. I'm interested in almost everything. I accumulate projects faster than I can finish them. It ends up being a mess. Sound familiar?
To deal with this I've tried all sorts of different todo lists, task management systems, productivity tools, tricks, techniques, etc. GTD, inbox zero, bullet journals, kanbans, bug trackers, you name it. Some of them have really good ideas, but none of them cover all my needs. I ended up with so many partial solutions that I was ignoring them all.
I needed a way to bring them all together. I needed a fuckometer.
It's an aggregator. It measures a bunch of different things and boils that data down into a single number representing how fucked you are, in percent. Also generates graphs to help track progress, points out which things are most fucked right now, and gives suggestions about what you could be doing right now to get less fucked.
It's a way to stay productive. It can help provide motivation and guidance by gamifying life, sort of. If you can get the graph lower than it was yesterday, or last week, or last month, then you're making progress. If it gets higher, you may be getting behind.
It's a way to focus on the right things at the right times. It tells you what your biggest fires are at any given moment so you won't neglect anything for too long.
It is not a magic bullet, nor the sort of thing you can simply install with one click and have it work immediately. In order to get useful results, you'll need to decide what things you need to work on, and make it grab data from those things. You will likely need to write your own conduits to use as factors in the equation, so it tries to make those conduits relatively easy to create.
At its core, the fuckometer simply gathers data from a bunch of conduits or
"factors", takes a weighted average of those, and periodically logs the
results. This data is kept in $HOME/.fuckometer/ for easy access from other
programs.
It's designed to be a collection of programs all running independently, sharing
data through the ~/.fuckometer/ directory tree. The core process gathers
data from the factors/* directories, processes it, then saves to a few files:
- factors.log: Periodic snapshot of every factor's "fucks" score, for graphing and later trend analysis.
- fires: A list of each factor and how much it adds to the total weighted score, sorted by biggest fire first.
- log: The fuckometer score, every 10 minutes. Used for graphing.
- raw: The most recent fuckometer score.
- text: Formatted text summary of the current score and trend, suitable for human use.
- trend: What direction is the score moving in right now? Has 5 different angles: ^, /, -, , or v (up fast, up slow, steady, down slow, down fast)
Each factor is expected to periodically write a few values:
- factors/my_factor/fucks: On a scale of 0 to 100, how fucked are things right now for this particular conduit? (Can exceed 100 or go below 0, but is recommended to stay approximately in the 0 to 100 range.)
- factors/my_factor/text: Human-formatted text summary of this factor's data, suitable for display on a LCD. If there are multiple lines of text, one line will be chosen at random.
- factors/my_factor/raw: Optional. This factor's current value in the factor's internal format. Can be whatever.
The factors directory contains several conduits that I use. Since each person uses different tools, these are intended as examples to help you write your own.
Here's what I have so far:
-
Chrome tabs: If you tend to leave tabs open until you're done with them, using them like sticky notes, this can help you remember to get back to them later to finish the task associated with them.
-
Email: Track email inboxes and a special "TODO" tag, to encourage you toward "inbox zero" and remind you to finish messages you marked for later. In my setup, this is done by ssh'ing to my email VPS and running a script there to generate the data. It gets data from 'notmuch' and Maildir queries.
-
Money flow: How much are you worth? Is that amount increasing or decreasing? Are you hitting your monthly income goals? Lets you know you're fucked if your worth is low or decreasing. This implementation queries my BeanCount ledger, which is a plaintext double-entry accounting system.
-
Steins;Gate: From the popular anime of the same name, this tells me each day which world line I'm on and, if I haven't broken the 1% barrier yet, tells me how fucked that world line is. (is intended as a template you can copy to make your own factors in Python)
-
Time to live: According to statistical estimates, how long until you reach your expiration date? Picks a new estimate each morning, and calculates its "fucked level" if that number gets below 20 years.
-
TKDO scores: Using my TKDO task management system, take an average of the top 20 scores. This encourages actually paying attention to my TKDO lists and using its recurring task features to stay on top of things like bills and exercise and daily tasks. (TKDO is a fairly powerful implementation of "Getting Things Done" concepts based on plain text files and some scripts.)
-
Todo list: Using a plaintext VimOutliner-style todo list with one heading per day, this encourages me to get a minimum number of tasks done each day, and to make sure I review past days to carry forward anything I need to finish or repeat. Starts with a todo "obligation" of zero each morning and rises on a sine curve until the end of the day, so if I'm on track I can keep the value near zero. If I'm slacking though, it'll rise up each day.
-
Todo list yesterday: Rolling average of the past 3 days of todo_list scores, to reward me for staying productive over time... or punish me for slacking too much. Makes it so that previous days' results don't just disappear each night.
-
Windows open: I tend to have a lot of windows open, using them kind of like sticky notes, leaving everything related to a project open until it's done. But then I see a shiny thing and move on to the next project, forgetting about the old ones. This helps me go back and actually finish things, then close the windows afterward. (uses a Sawfish 1.5 custom script to get window data)
-
Windows open on my notebook: Same, but on my notebook.
The system is designed to make it relatively easy for you to write your own factors, so the items above are mostly just examples of how to do that.
There are a few more I might add later too:
-
Work hours: Using my "XActivity" program, keep track of how many hours I've worked today and this week. Tell me how fucked (or not fucked) I am based on how much time I've logged. XActivity monitors keyboard and mouse events to determine when I'm active, and logs this data for every minute of every day for every computer I use. Additionally, it tracks which window was active at the time, down to the second, so I can tell what I spent my time on. This is then summarized into buckets, which I can use to figure out if I've been getting a lot of work done or if I was just browsing Facebook. The main upshot is that I can tell exactly how much time I've spent working, so I can tell whether I need to keep working or if I'm done for the day... and it's all automatic.
-
Bug trackers: How many open bugs are assigned to me or my projects? Let me know when my bug pile is getting big so I can do something about it.
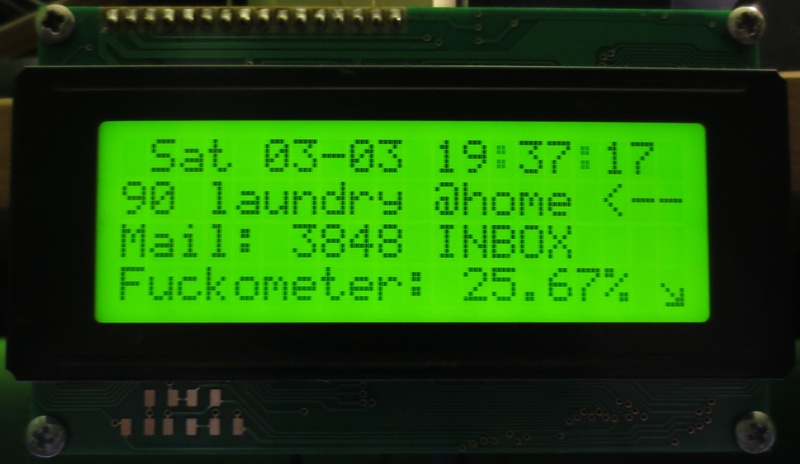
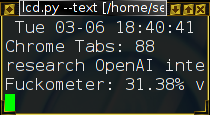
A script is included to display current status on a Matrix Orbital 20x4 LCD, or as plain text in a console.
Here's how that looks:
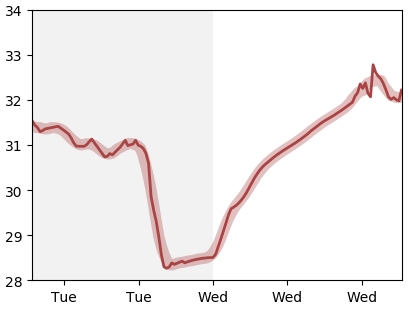
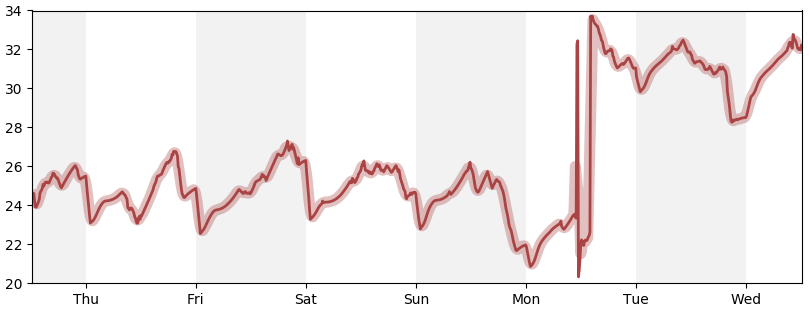
The included graphing scripts show results over time. These include the main graph and the factor details, for time windows of 24 hours, 7 days, 30 days, and 180 days. For example:
- Past 24 hours: Detailed view of one day. To make progress each day, try to
get the right edge of the graph lower than the left edge.
- Past 7 days: Somewhat wider view, to see short-term trends.
- Factors for 7 days: Status of individual factors over time, to see more
detailed trends.
I have some of my live data on my web site, as a communication tool to help others see how I'm doing. It's not quite the same as having a public todo list, but it's similar.
However, the full web UI isn't really implemented yet.
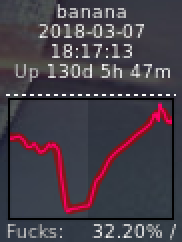
I also have the 24-hour fuckometer graph and some other data in my Conky status widget.
Conky config snippet:
${image /tmp/fuckometer-conky.png -p 0,48 -s 85x63 -f 60}


${color lightgrey}Fucks:${alignr}${color}${texeci 30 cut -c 12- $HOME/.fuckometer/text}
${alignr}${color}${head $HOME/.fuckometer/fires 8 30}
${alignr}${color}${head $HOME/.fuckometer/factors/windows_open/text 1 30}\
${alignr}${color}${head $HOME/.fuckometer/factors/chrome_tabs/text 1 30}\
${alignr}${color}${head $HOME/.fuckometer/factors/email_todo/text 1 30}\
${alignr}${color}${head $HOME/.fuckometer/factors/email_inboxes/text 1 30}\
A default config file can be generated at the command line for later editing...
cd fuckometer
mkdir ~/.fuckometer
./fuckometer.py --cfg > ~/.fuckometer/rc
The main thing to edit here is the weights list, to tell it how much each
factor matters. For example:
weights = [
    (200, 'money_flow'),   # important!
    (100, 'todo_list'),
    (100, 'todo_list_yesterday'),
    (100, 'tkdo_scores'),
    (100, 'windows_open'),
    ( 50, 'windows_open_chi'),
    (100, 'chrome_tabs'),
    (100, 'time_to_live'),
    ( 50, 'email_inboxes'),
    ( 50, 'email_todo'),
    (  1, 'steins_gate'),  # don't really care, totally random
    ]
I don't seriously expect anyone else to use this, because it's kind of janky and takes a while to set up, but if you'd like to give it a try, here's what it needs:
- Python
- PyLab / MatPlotLib (for graphs)
- PyCFG
- Probably a unix-like OS
- Familiarity / comfort with plain text files and a command line
- A burning need to get less fucked
- Time to make your own conduits
This might take a while. To use this tool...
- Make a config file, as described above.
- Run the fuckometer. Expect to re-start it a lot while adding conduits.
- Display the results. For example,
./lcd.py --textto see realtime results. Or, after some graphs are made,feh --reload 60 /tmp/fuckometer-24h.png. - Generate graphs. You'll probably want to edit
graph-update-loop.shand then run it. - Write conduits. The easiest ones are either a shell script or copying
steins_gate.pyas a template. - Run the conduits. A
start-all-factors.shscript is provided to make it easier to start or re-start everything.
More new-user-friendly installation and setup may be added at some point, but for now it's still a very DIY sort of system.
