⚠️ **This project / code is broken and does not work anymore **: ENEDIS changed their API and I've no time anymore for now to redevelop a new solution as a moral person required. I've postpone development until ENEDIS open again their API to customers. see Related Bugs
The excellent job done by outadoc on project linkindle available on Github. I used the linky module to avoid re-do the great job done.
python3and following dependenciesossysdatetimelocalerelativedelta(fromdateutil.relativedelta)tz(fromdateutil)InfluxDBClient(frominfluxdb)linky(see Externals above)jsonargparseloggingfake_useragentpprint(not mandatory, just for debugging)
If you want to debug, please set level=logging.INFO to level=logging.DEBUG
Verify you have requirements by activating "Courbe de charge" on Enedis Portal
Please also remember kWh is provided by "ordre". So if you have a 30min step "ordre", you need to divide by twice kW per hour.
Create d
> CREATE DATABASE linky
> CREATE USER "linky" WITH PASSWORD [REDACTED]
> GRANT ALL ON "linky" TO "linky"
Example : 5 years (1825d)
> ALTER RETENTION POLICY "autogen" ON "linky" DURATION 1825d SHARD DURATION 7d DEFAULT
{
  "measurement": "conso_elec",
    "tags": {
      "fetch_date" :        /DATE WHEN VALUE WHERE FETCH FROM API ENEDIS/,
      "heures_creuses" :    /1 IF ORDRE IS WHEN WE ARE IN "HEURES CREUSES", 0 IF NOT/,
      "heures_pleines" :    /1 IF ORDRE IS WHEN WE ARE IN "HEURES PLEINES", 0 IF NOT/,
      "heures_normales" :   /1 IF ORDRE IS WHEN WE ARE IN "HEURES NORMALES", 0 IF NOT/,
    },
    "time": '%Y-%m-%dT%H:%M:%SZ',
    "fields": {
      "value":    /VALUE IN Wh (SO x1000) AND DIVIDED BY 2 (ORDRE = 30min),
      "max":     /"PUISSANCE SOUSCRITE" RETURN BY ENEDIS in WH)/,
    }
}
Well, yes it is dirty, but ... you can perhaps improve using vault or anything related to secret storage :D Please do an MR or fork if you have any better idea.
Copy .params.example to .params and fill with your own values :
enedis: username and password for API Enedisinflux: your InfluxDB databasehc:- if you have "heures creuses/heures pleines", fill start & end hours, so values will be tag with hc = 1 during this timewindow on InfluxDB datapoints
- leave empty as
[]if you don't have 'heures creuses' / 'heures pleines'
{
    "enedis":
    {
        "username": 	  "",
        "password": 	  ""
    },
    "influx":
    {
        "host": 	      "",
        "port": 	      8086,
        "db": 		      "",
        "username":     "",
        "password":     "",
        "ssl":		      true,
        "verify_ssl": 	true
    },
    "hc":
    [{
        "start":   { "h": 1, "m": 0 },
        "end":     { "h": 7, "m": 0 }
     },{
        "start":   { "h": 12, "m": 30 },
        "end":     { "h": 14, "m": 30 }
    }]
}
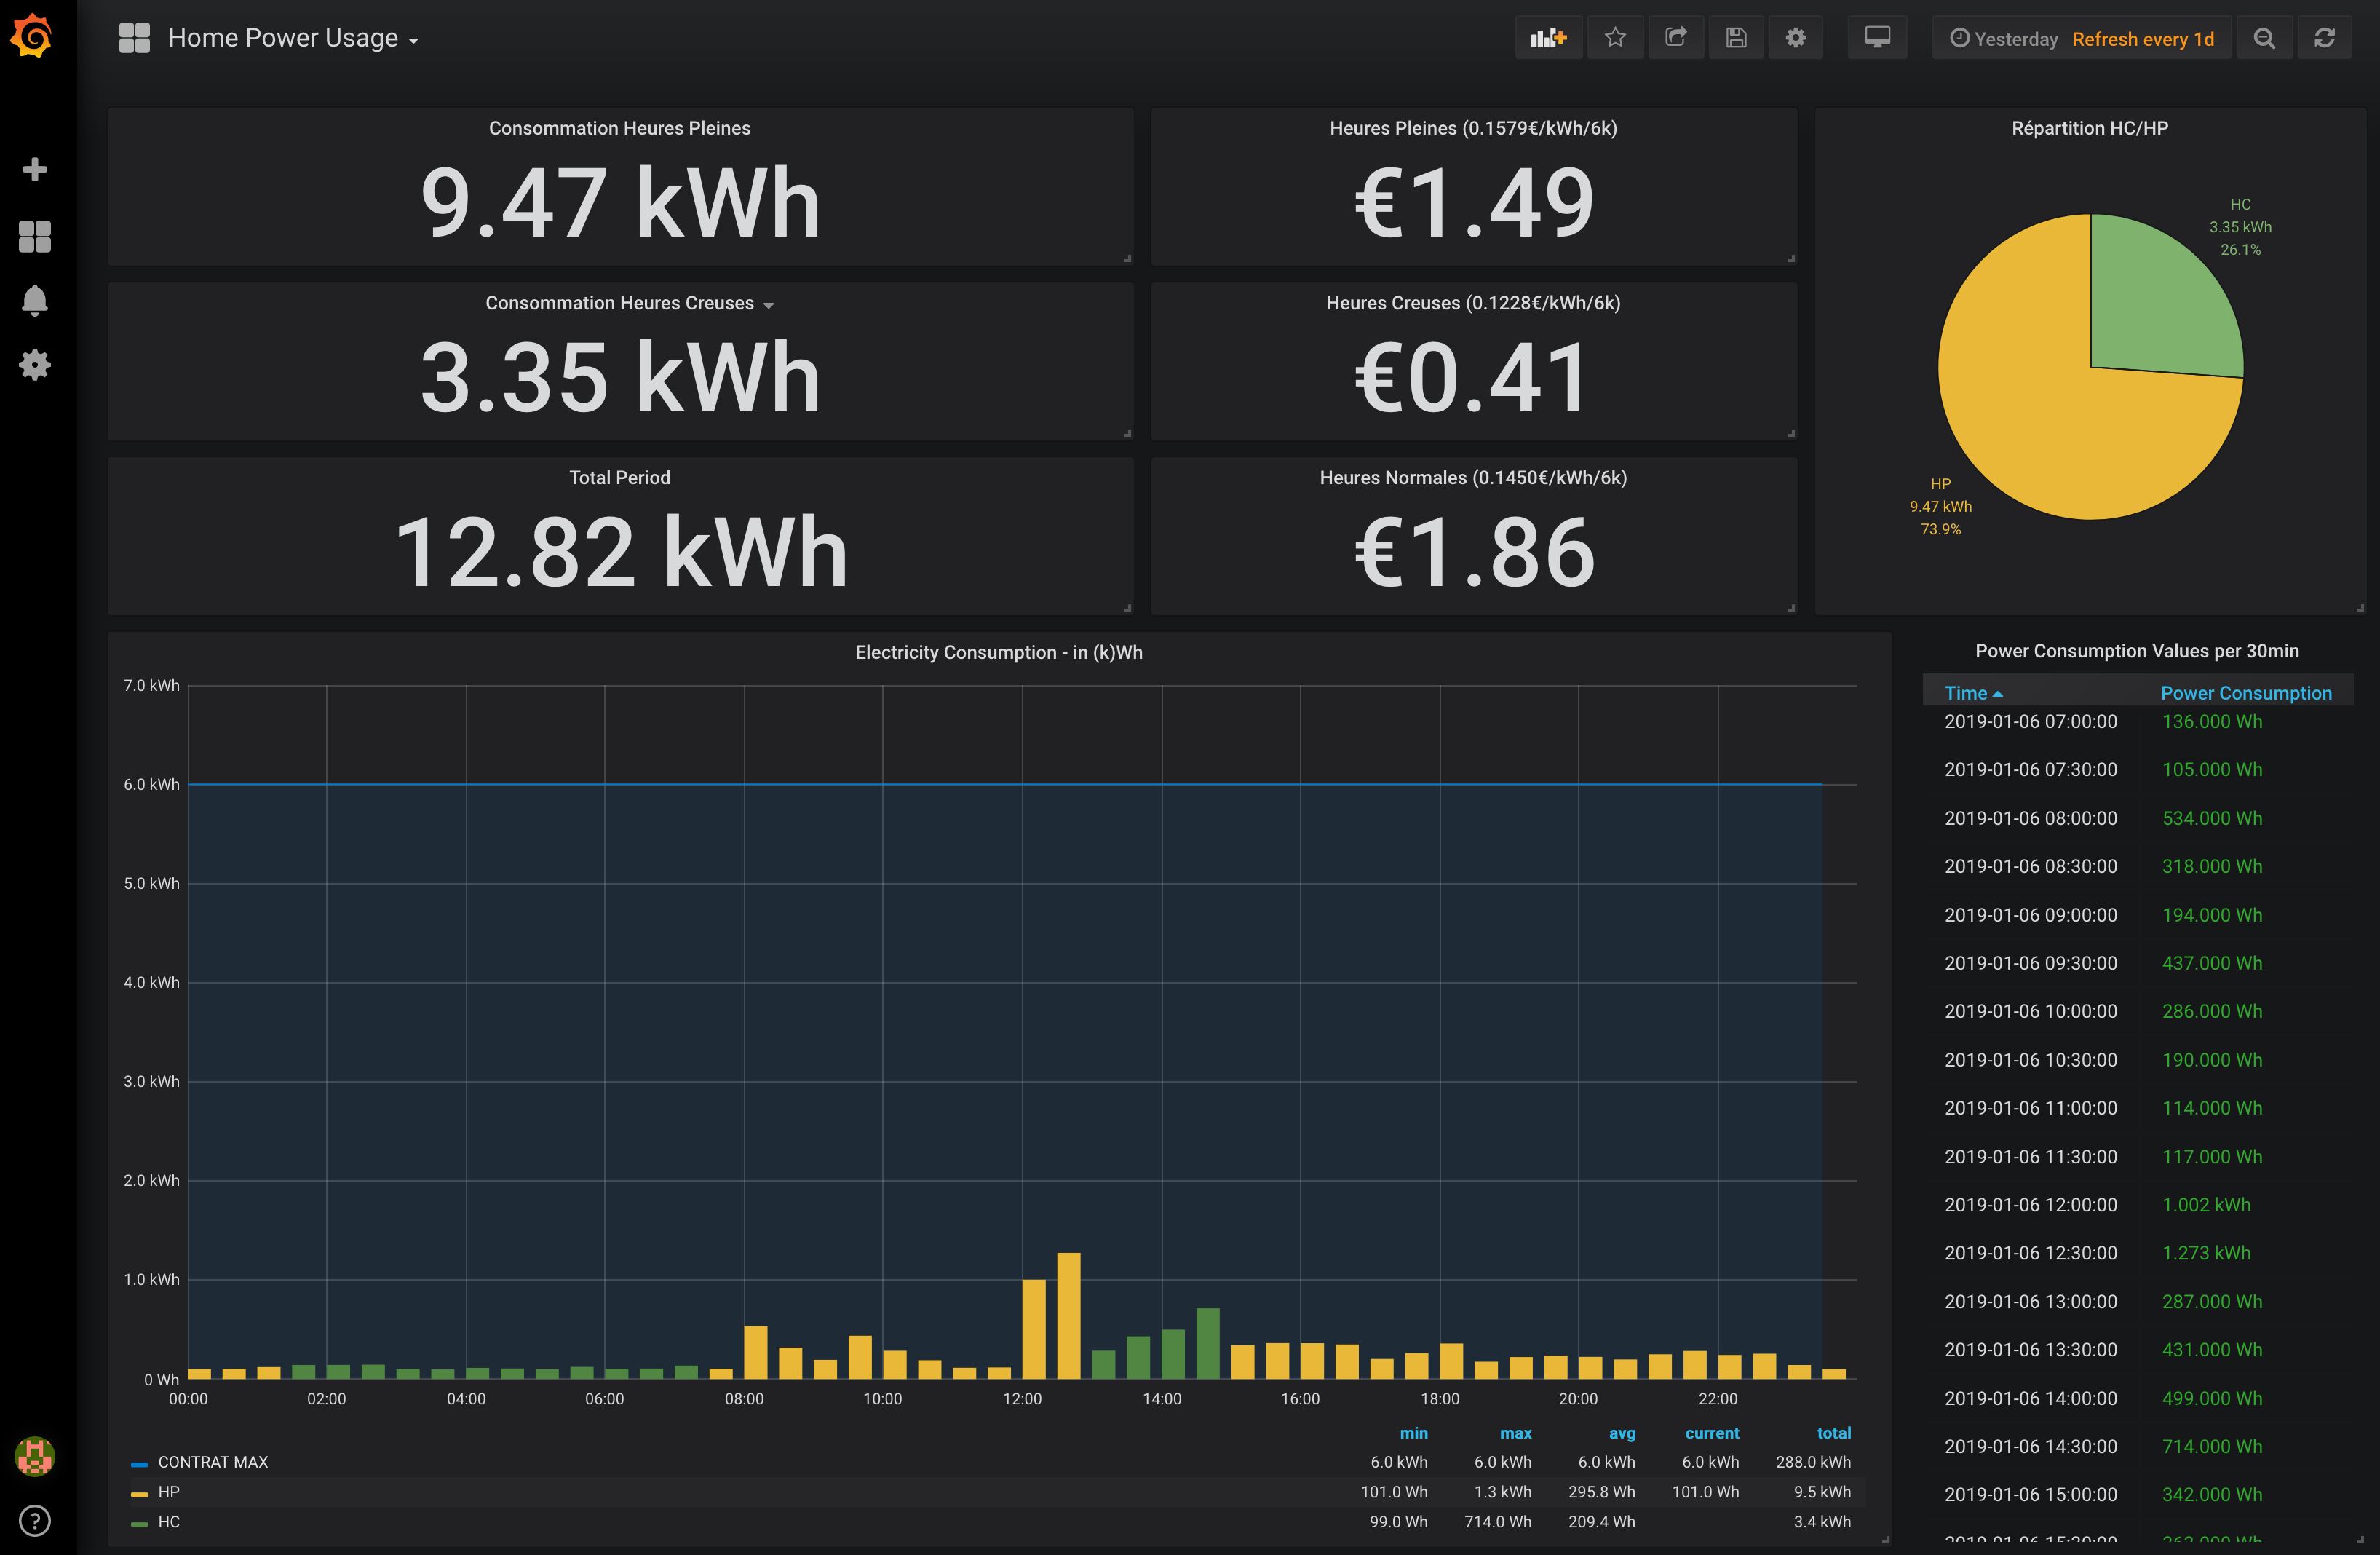
Please verify first you have grafana-piechart-panel installed
# grafana-cli plugins install grafana-piechart-panel
# systemctl restart grafana-server
Replace DS_YOUR_LINKYDB with our own database source in Grafana dashboard grafana.dashboard.json and then import it
Change variables prices for (sorry only in french :D)
- VAR_STD_KWH : "Tarif en € par kWh pour Heures pleines avec contrat option base"
- VAR_HP_KWH : "Tarif en € par kWh pour Heures pleines avec contrat heures pleines/creuses"
- VAR_HC_KWH : "Tarif en € par kWh pour Heures creuses avec contrat heures pleines/creuses"
If you don't have a contrat heures pleines/creuses you can use grafana.dashboard-simple.json
# python3 linkynflux.py --days=16
2019-01-06 20:38:34,767 logging in InfluxDB Server Host ****...
2019-01-06 20:38:34,767 logged in InfluxDB Server Host **** succesfully
2019-01-06 20:38:34,767 logging in Enedis URI https://espace-client-particuliers.enedis.fr/group/espace-particuliers...
2019-01-06 20:38:35,028 logged in successfully!
2019-01-06 20:38:35,028 get Data from Enedis from 21/12/2018 to 06/01/2019
2019-01-06 20:38:38,976 found value ordre(  1) :   -2.00 kWh at 2018-12-21T00:00:00Z (HC:0)
2019-01-06 20:38:38,976 found value ordre(  2) :   -2.00 kWh at 2018-12-21T00:30:00Z (HC:0)
2019-01-06 20:38:38,976 found value ordre(  3) :   -2.00 kWh at 2018-12-21T01:00:00Z (HC:0)
2019-01-06 20:38:38,976 found value ordre(  4) :   -2.00 kWh at 2018-12-21T01:30:00Z (HC:1)
[...]
2019-01-06 20:38:39,032 found value ordre(767) :    0.49 kWh at 2019-01-05T23:00:00Z (HC:0)
2019-01-06 20:38:39,033 found value ordre(768) :    0.36 kWh at 2019-01-05T23:30:00Z (HC:0)
2019-01-06 20:38:39,033 trying to write 768 points to influxDB
2019-01-06 20:38:39,962 done
If value is -1kWh it's because dataset return by Enedis API is empty (no idea how long data are available).
When it works, just put in a crontab to fetch last day (d=1) value (change $USER)
# cat /etc/crontab | grep linky
00 6    * * *   $USER    cd /home/$USER//linkyndle &&  python3 linkynflux.py -d 1
