-
Notifications
You must be signed in to change notification settings - Fork 1
Debugging the engine
This page has some hints about debugging the engine.
See also Crashes for advice on handling engine crashes (specifically around obtaining stack traces, and reporting crashes in AOT Dart code).
Once the appropriate version of the engine is built (see Compiling the engine), run your Flutter app with:
$ flutter run --local-engine=XXXX`
to run an app with the local engine where XXXX should be replaced with the version you wish to use. For example, use --local-engine=android_debug_unopt to run a debug android engine or --local-engine=ios_debug_sim_unopt to run a debug iOS simulator engine.
It is important to always have a host_XXXX version of the engine built when using a local engine since Flutter uses the host build's version of Dart.
If the engine roll is failing (see Autorollers), you can use git bisect on the engine repo to track down the offending commit, using the --local-engine command as described above to run the failing framework test with each version of the engine.
All OpenGL calls in Skia are guarded by either the GR_GL_CALL_NOERRCHECK or GR_GL_CALL_RET_NOERRCHECK macros. Trace events may be added in these macros to trace all GL calls made by Skia, for example in a patch like this.
Due to the number of events traced to the timeline, the trace buffer may be filled up very quickly. Unless you want to see only the traces for the past few frames, use an endless trace buffer (flutter run --endless-trace-buffer turns on an endless trace buffer).
Also, make sure to run your application with the --trace-skia flag.
Building with flutter --local-engine will set a LOCAL_ENGINE Xcode build setting in your Flutter application Generated.xcconfig file. This will be set until you run flutter run again with either a different --local-engine option, or with none at all (which will unset it).
You can speed up your workflow by adding the --config-only flag to set up the Xcode build settings and plugins, but not compile the app. For example:
$ flutter build ios --local-engine ios_debug_unopt --config-only
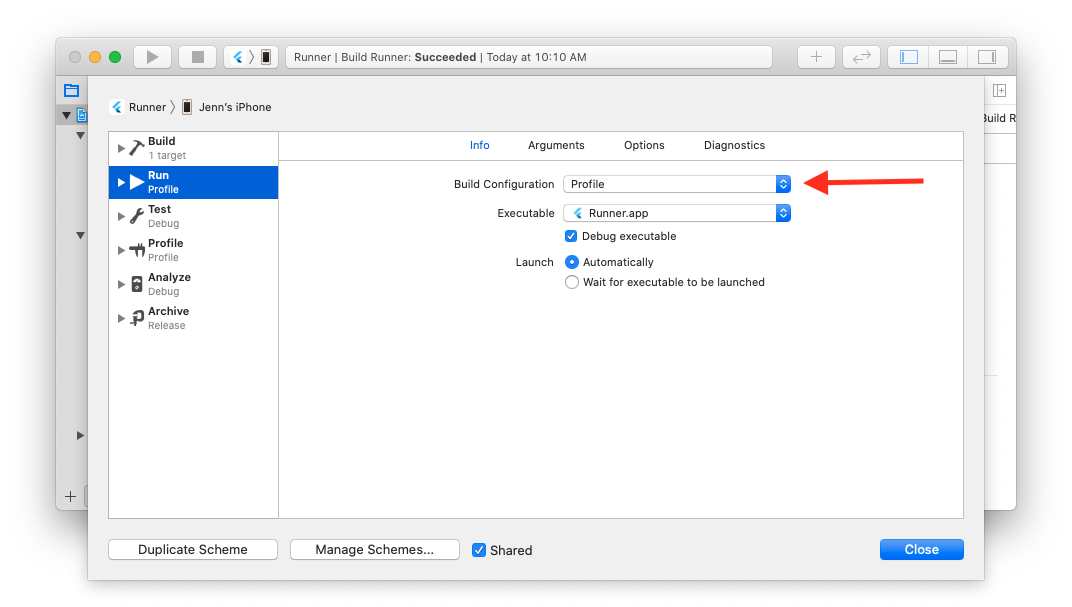
To start debugging, open your Flutter app ios/Runner.xcworkspace file in Xcode. Ensure Product > Scheme > Edit Scheme > Run > Build Configuration matches your engine runtime mode (defaults to Debug).

Add an engine symbol breakpoint via Debug > Breakpoints > Create Symbolic Breakpoint.... The Symbol field should be the engine symbol you're interested in, like -[FlutterEngine runWithEntrypoint:] (note the -[ prefix has no space).
You can also set a breakpoint directly with lldb by expanding Flutter > Runner > Supporting Files > main.m in the Runner Project Navigator. Put a breakpoint in main() and start the application by clicking the Run button (CMD + R). Then, set your desired breakpoint in the engine in lldb via breakpoint set -....
See https://github.com/flutter/engine/blob/master/sky/tools/flutter_gdb#L13
First, import the Android embedding into Android studio.
- Import the
engine/src/flutter/shell/platform/androidsubdirectory as a new project. It's important to pick this specific directory. IntelliJ needs this as the root in order to make sense of the package structure. - Mark the project as depending on the engine's SDK and Java versions (currently 29 and 8). The option should be visible under
File > Project Structure > Project Settings > Project. - (Optional) Manually tell the IDE to look for any JARs needed by the embedding code in
engine/src/third_party/android_embedding_dependencies/libto fix "Missing import" errors. The option should be visible underFile > Project Structure > Modules, then by selecting theandroidmodule and clicking on theDependenciestab.
Next, build and run a flutter app using flutter run --local-engine. It may be helpful to configure the Android app to wait for the local debugger on start.
Then hit the "Attach debugger" button in Android Studio, click "Show all processes" in the pop up, and select your app from the list and hit OK.
Flutter tool will by default parse out any non-error output from the engine. Error logs will be displayed. Logging is handled though the FML library's logging.h
- Home of the Wiki
- Roadmap
- API Reference (stable)
- API Reference (master)
- Glossary
- Contributor Guide
- Chat on Discord
- Code of Conduct
- Issue triage reports
- Our Values
- Tree hygiene
- Issue hygiene and Triage
- Style guide for Flutter repo
- Project teams
- Contributor access
- What should I work on?
- Running and writing tests
- Release process
- Rolling Dart
- Manual Engine Roll with Breaking Commits
- Updating Material Design Fonts & Icons
- Postmortems
- Setting up the Framework development environment
- The Framework architecture
- The flutter tool
- API Docs code block generation
- Running examples
- Using the Dart analyzer
- The flutter run variants
- Test coverage for package:flutter
- Writing a golden-file test for package:flutter
- Setting up the Engine development environment
- Compiling the engine
- Debugging the engine
- Using Sanitizers with the Flutter Engine
- Testing the engine
- The Engine architecture
- Flutter's modes
- Engine disk footprint
- Comparing AOT Snapshot Sizes
- Custom Flutter engine embedders
- Custom Flutter Engine Embedding in AOT Mode
- Flutter engine operation in AOT Mode
- Engine-specific Service Protocol extensions
- Crashes
- Supporting legacy platforms
- Metal on iOS FAQ
- Engine Clang Tidy Linter
- Why we have a separate engine repo
- Reduce Flutter engine size with MLGO
- Setting up the Plugins development environment
- Setting up the Packages development environment
- Plugins and Packages repository structure
- Plugin Tests
- Contributing to Plugins and Packages
- Releasing a Plugin or Package
- Unexpected Plugins and Packages failures
