Skip to content

Scripts to get previous support and resistance price zones in markets.

License

Notifications You must be signed in to change notification settings

botum/sure-indicator

Folders and files

NameName
Last commit message
Last commit date

Latest commit


History

6 Commits


Repository files navigation

ALERT

All this code is very experimental, not even close to having a release, has flaws all over. WIP

sure-indicator

Different ways to get support and resistance (horizontal) price zones in market data dataframes.

How?

In this approach we are dealing with little information about 1000 tikers. At first I do not expect good results from this but it is interesting to try.

Currently there is one OHCL approach with a sklearn lib MeanShift clustering which is fast and it could be fine tunned to obtain better results.

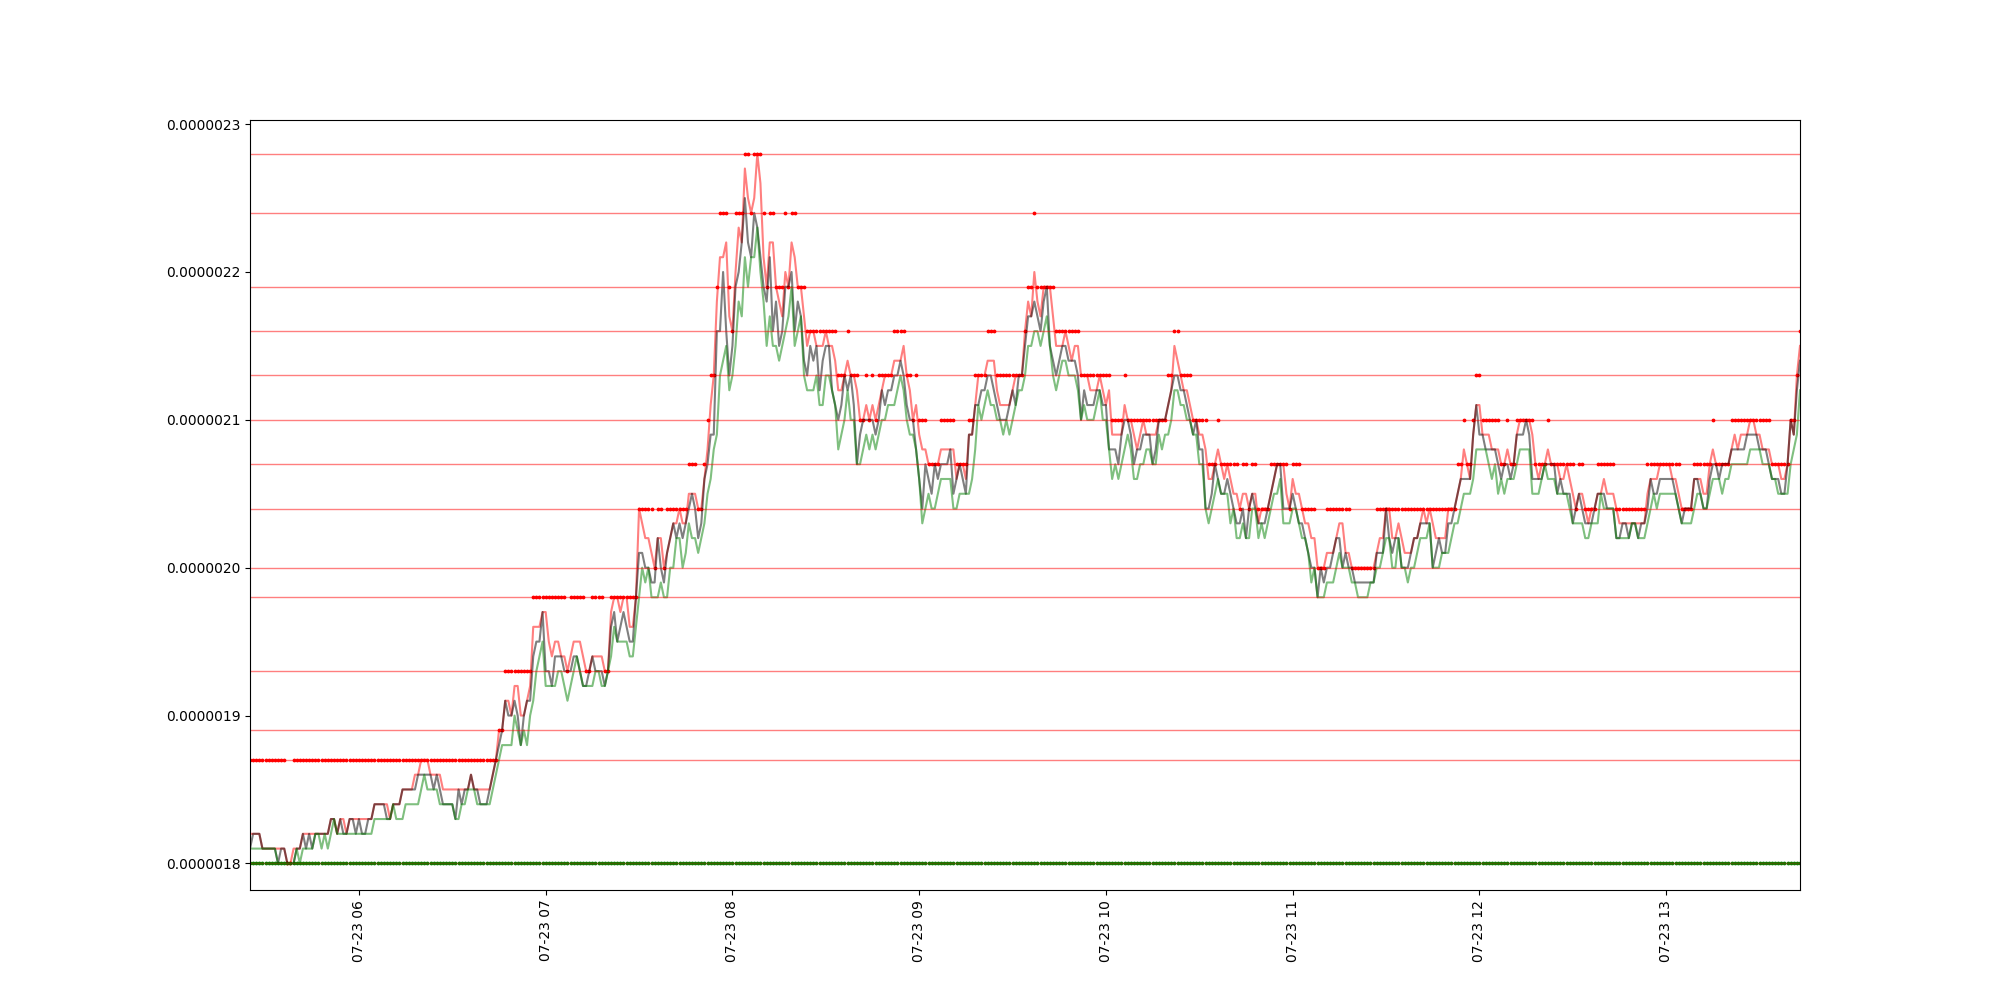
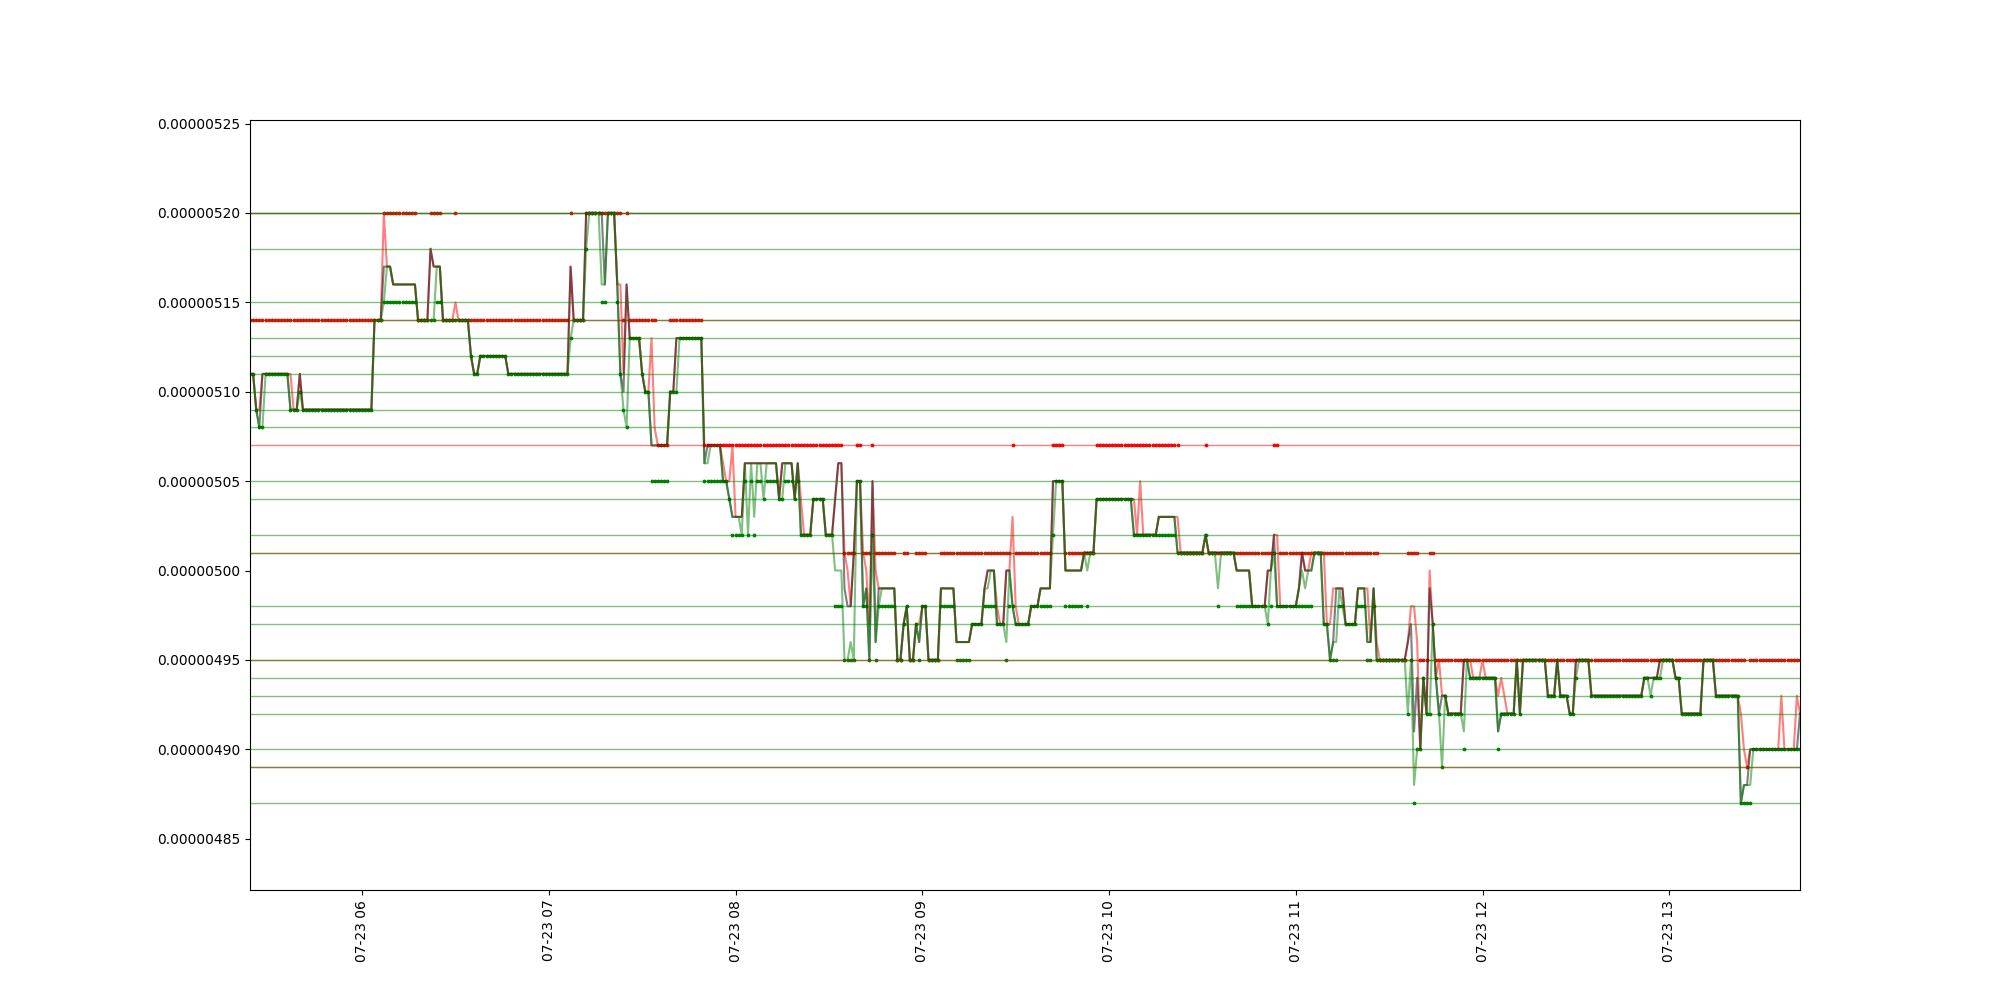
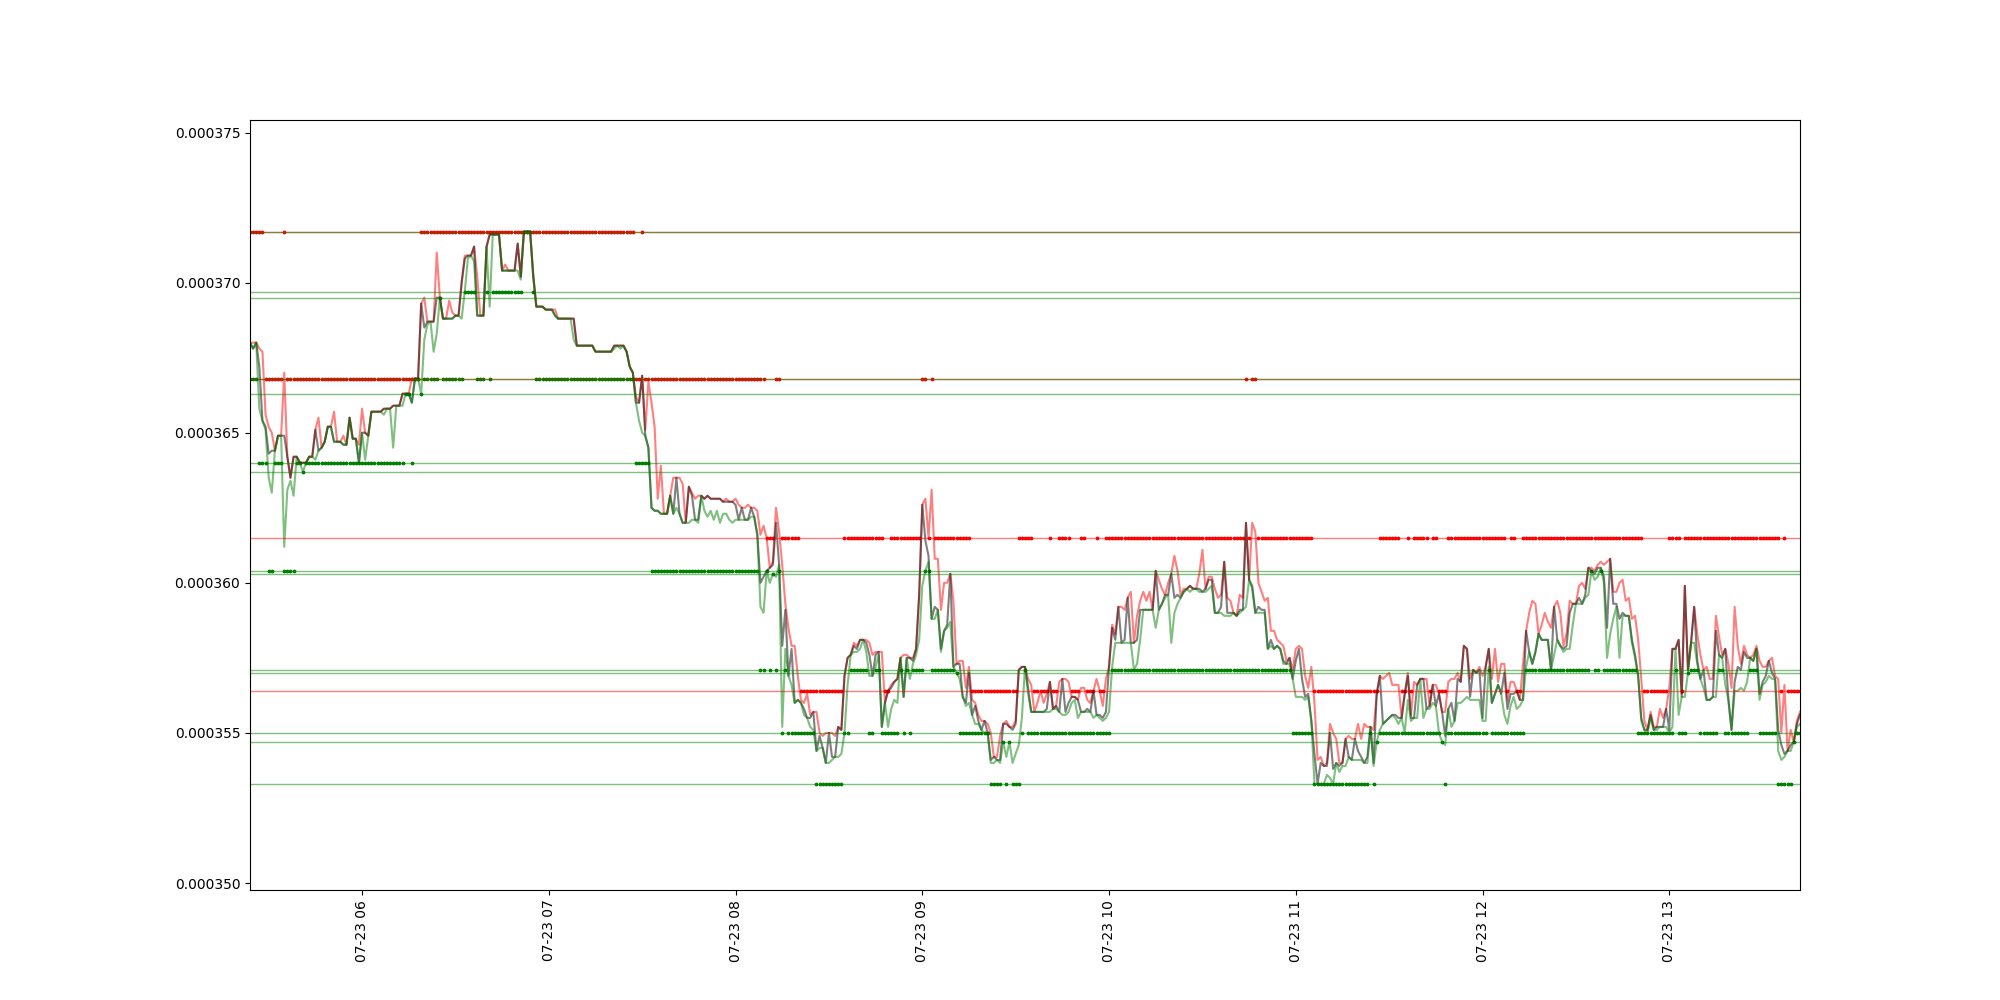
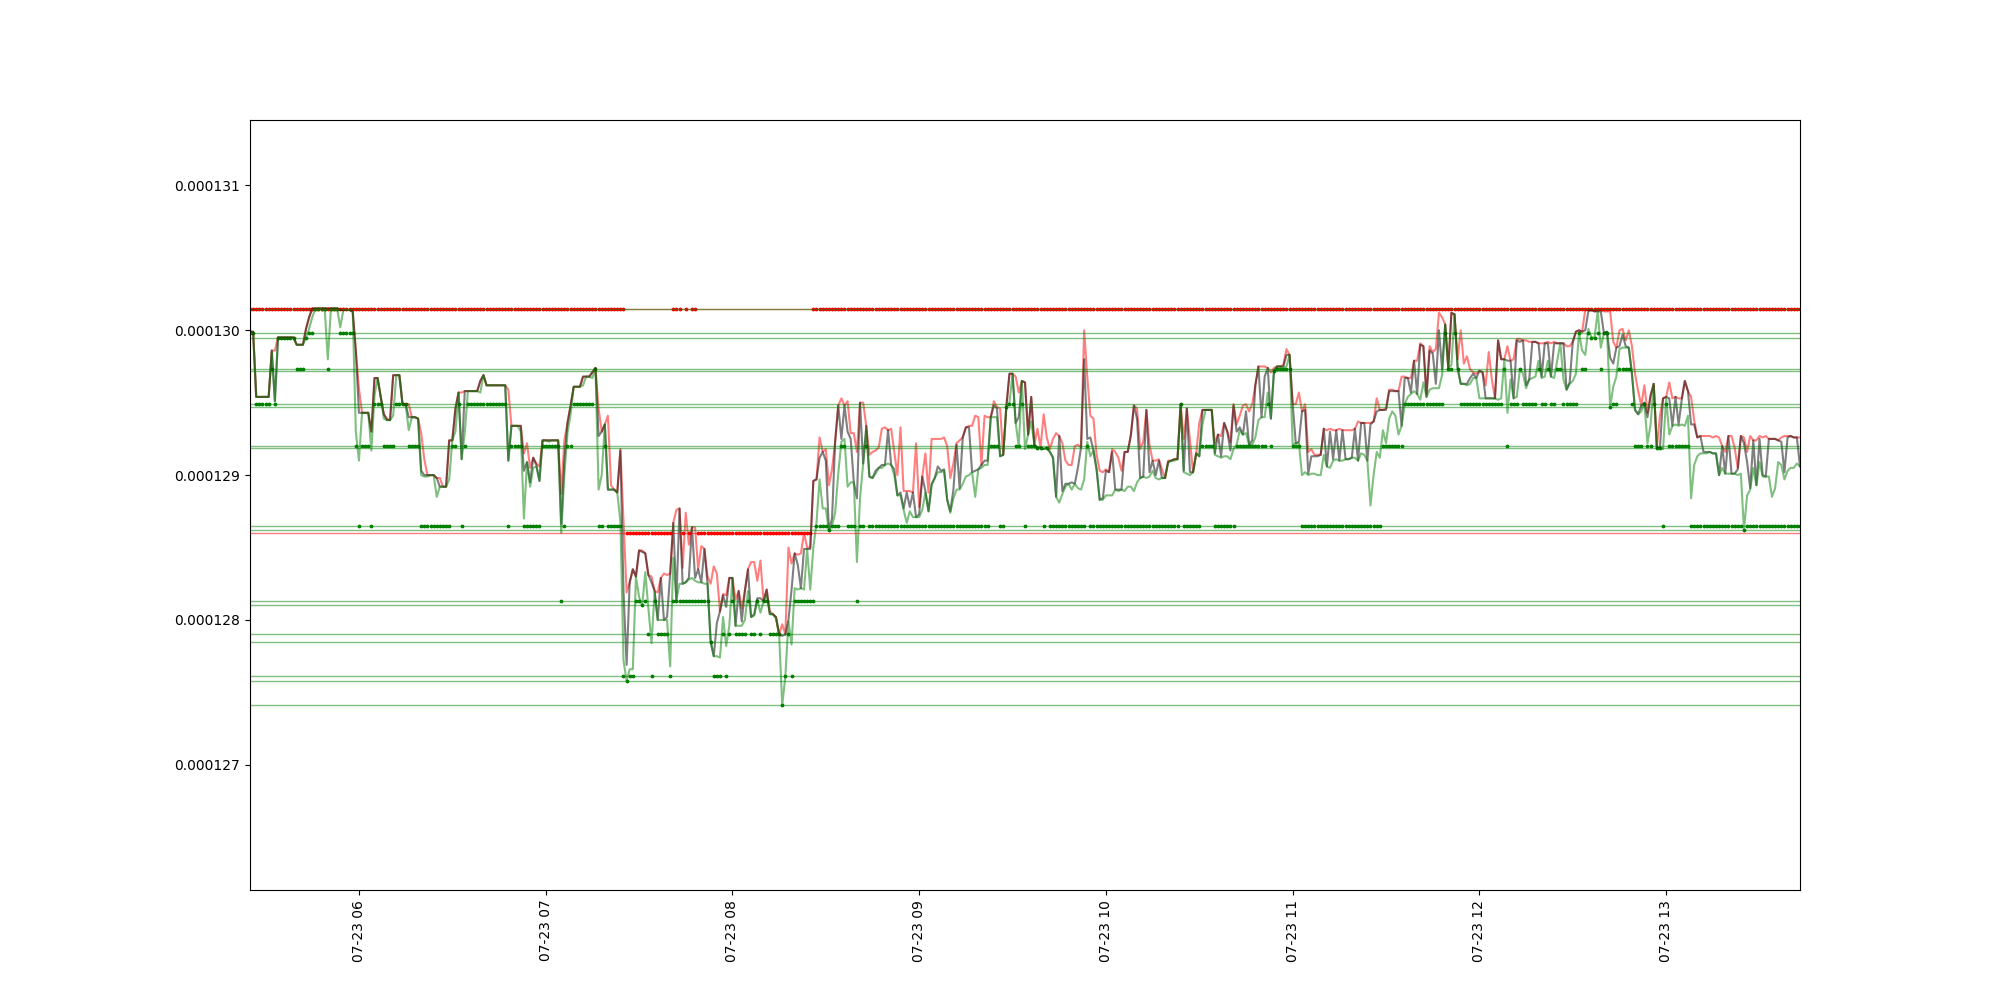
Current plots

This are current plots, which are not very usefull. Based on not very tunned settings, only 999 tickers of data.
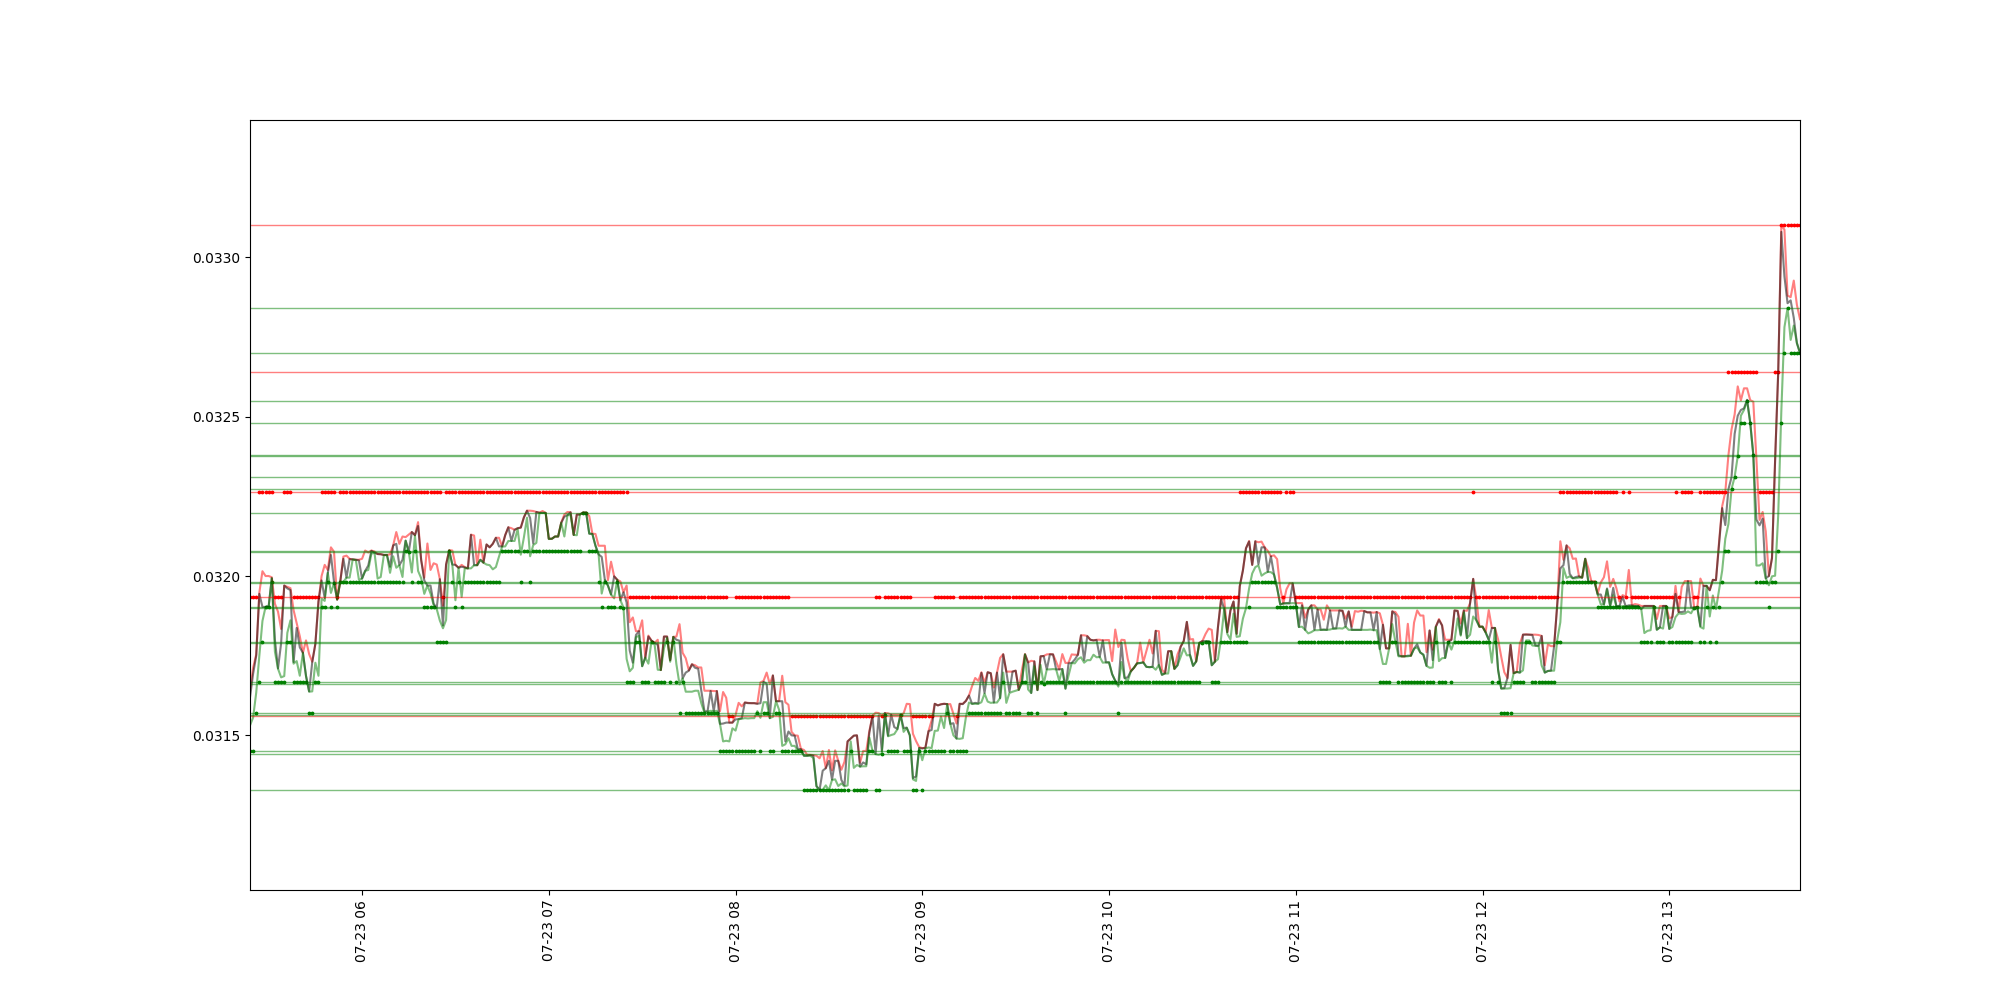
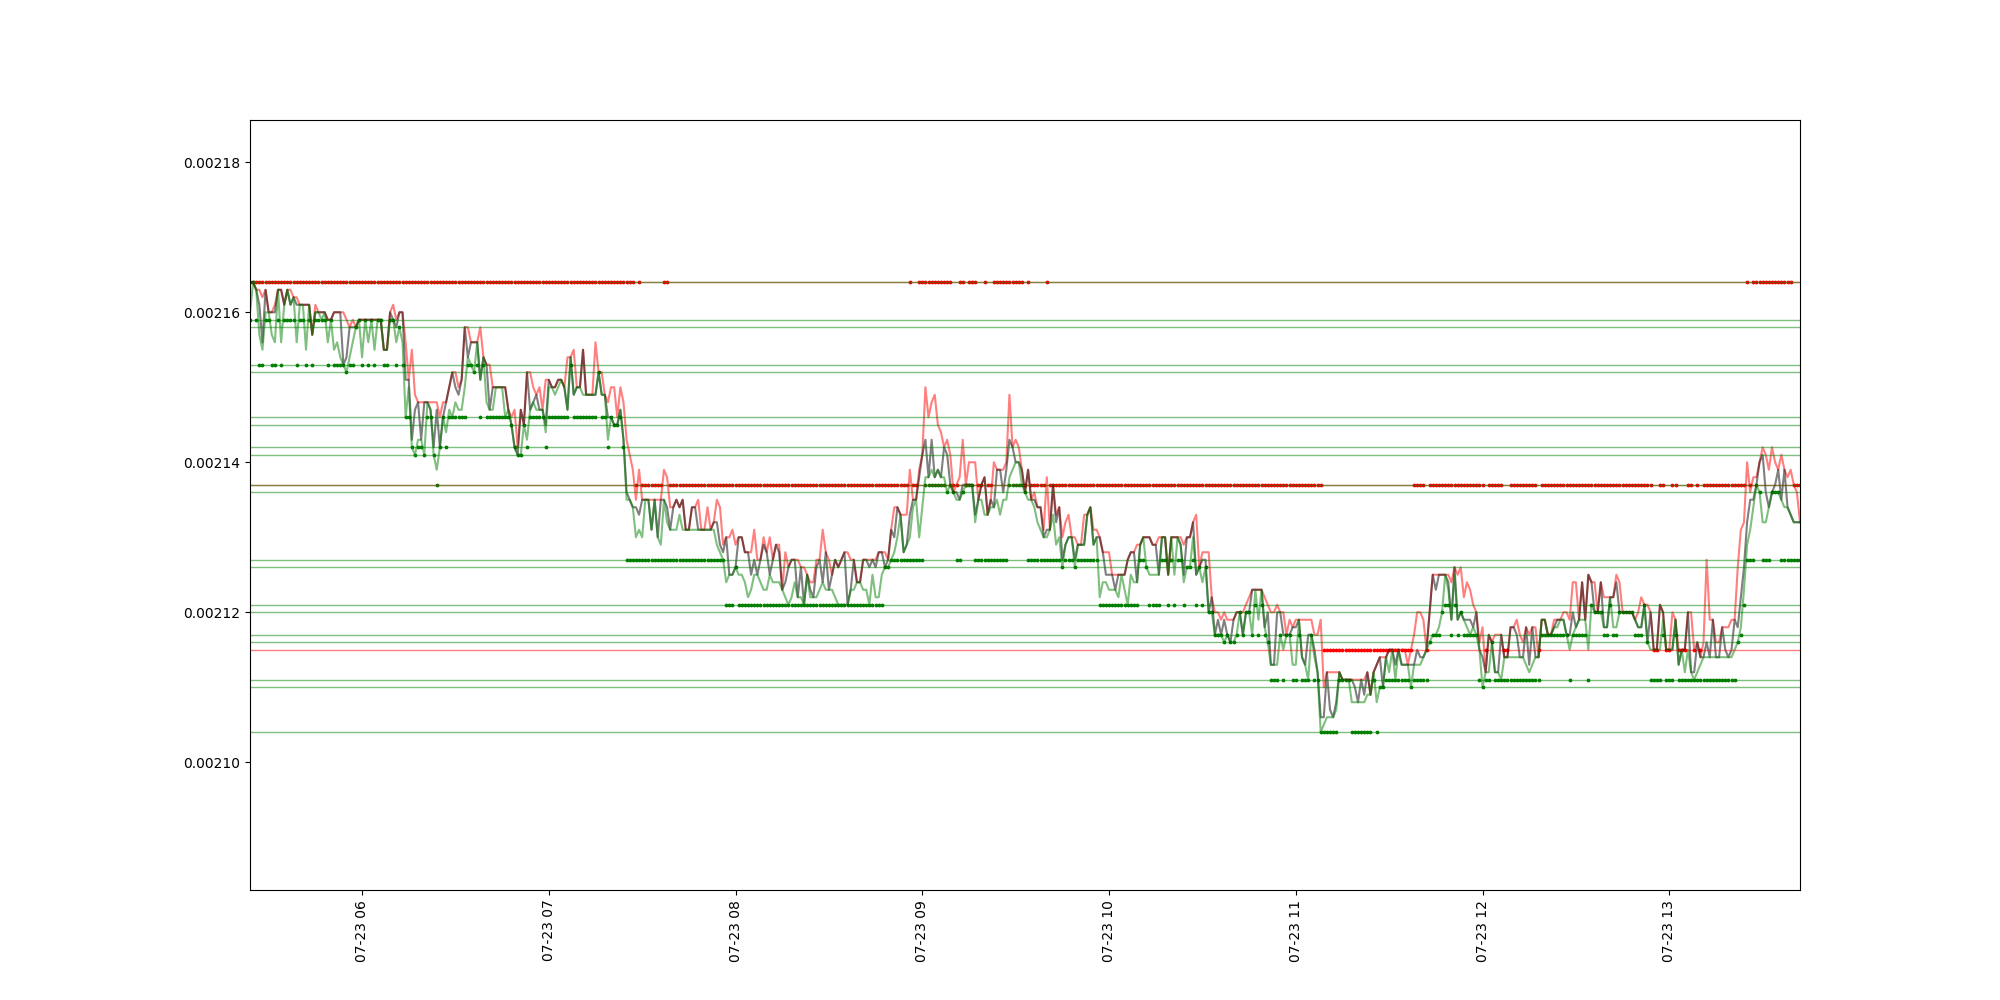
trendlines trendlines trendlines trendlines trendlines trendlines

About

Scripts to get previous support and resistance price zones in markets.

Resources

License

Stars

Watchers

Forks

Releases

No releases published

Packages

No packages published

Languages