Kubernetes aware network traffic monitoring.
- DaemonSet pod starts on each node.
- Conntrack entries are fetched for pods running on each at configured interval (5 seconds by default).
- If Cilium is used then conntrack records are fetched from eBPF maps located at host /sys/fs/bpf. These maps are created by Cilium.
- If Linux Netfilter Conntrack module is used then Netlink is used to get these records.
- Records are reduced by source IP, destination, IP and protocol.
- Kubernetes context is added including source and destination pods, nodes, node zones, ips.
- Exporter can export logs to http or prometheus.
Egressd runs as priviledged container for a few reasons:
- DNS tracer uses eBPF.
- Fetch conntrack entries:
- Bidirectional mount propogation is used to enable netfilter conntrack accounting and mount cgroupv2.
- If Cilium is used collector reads from ebpf maps which stores data in kernel.
Install demo with preconfigured grafana and prometheus metrics.
curl -fsSL https://raw.githubusercontent.com/castai/egressd/master/demo.sh | bash
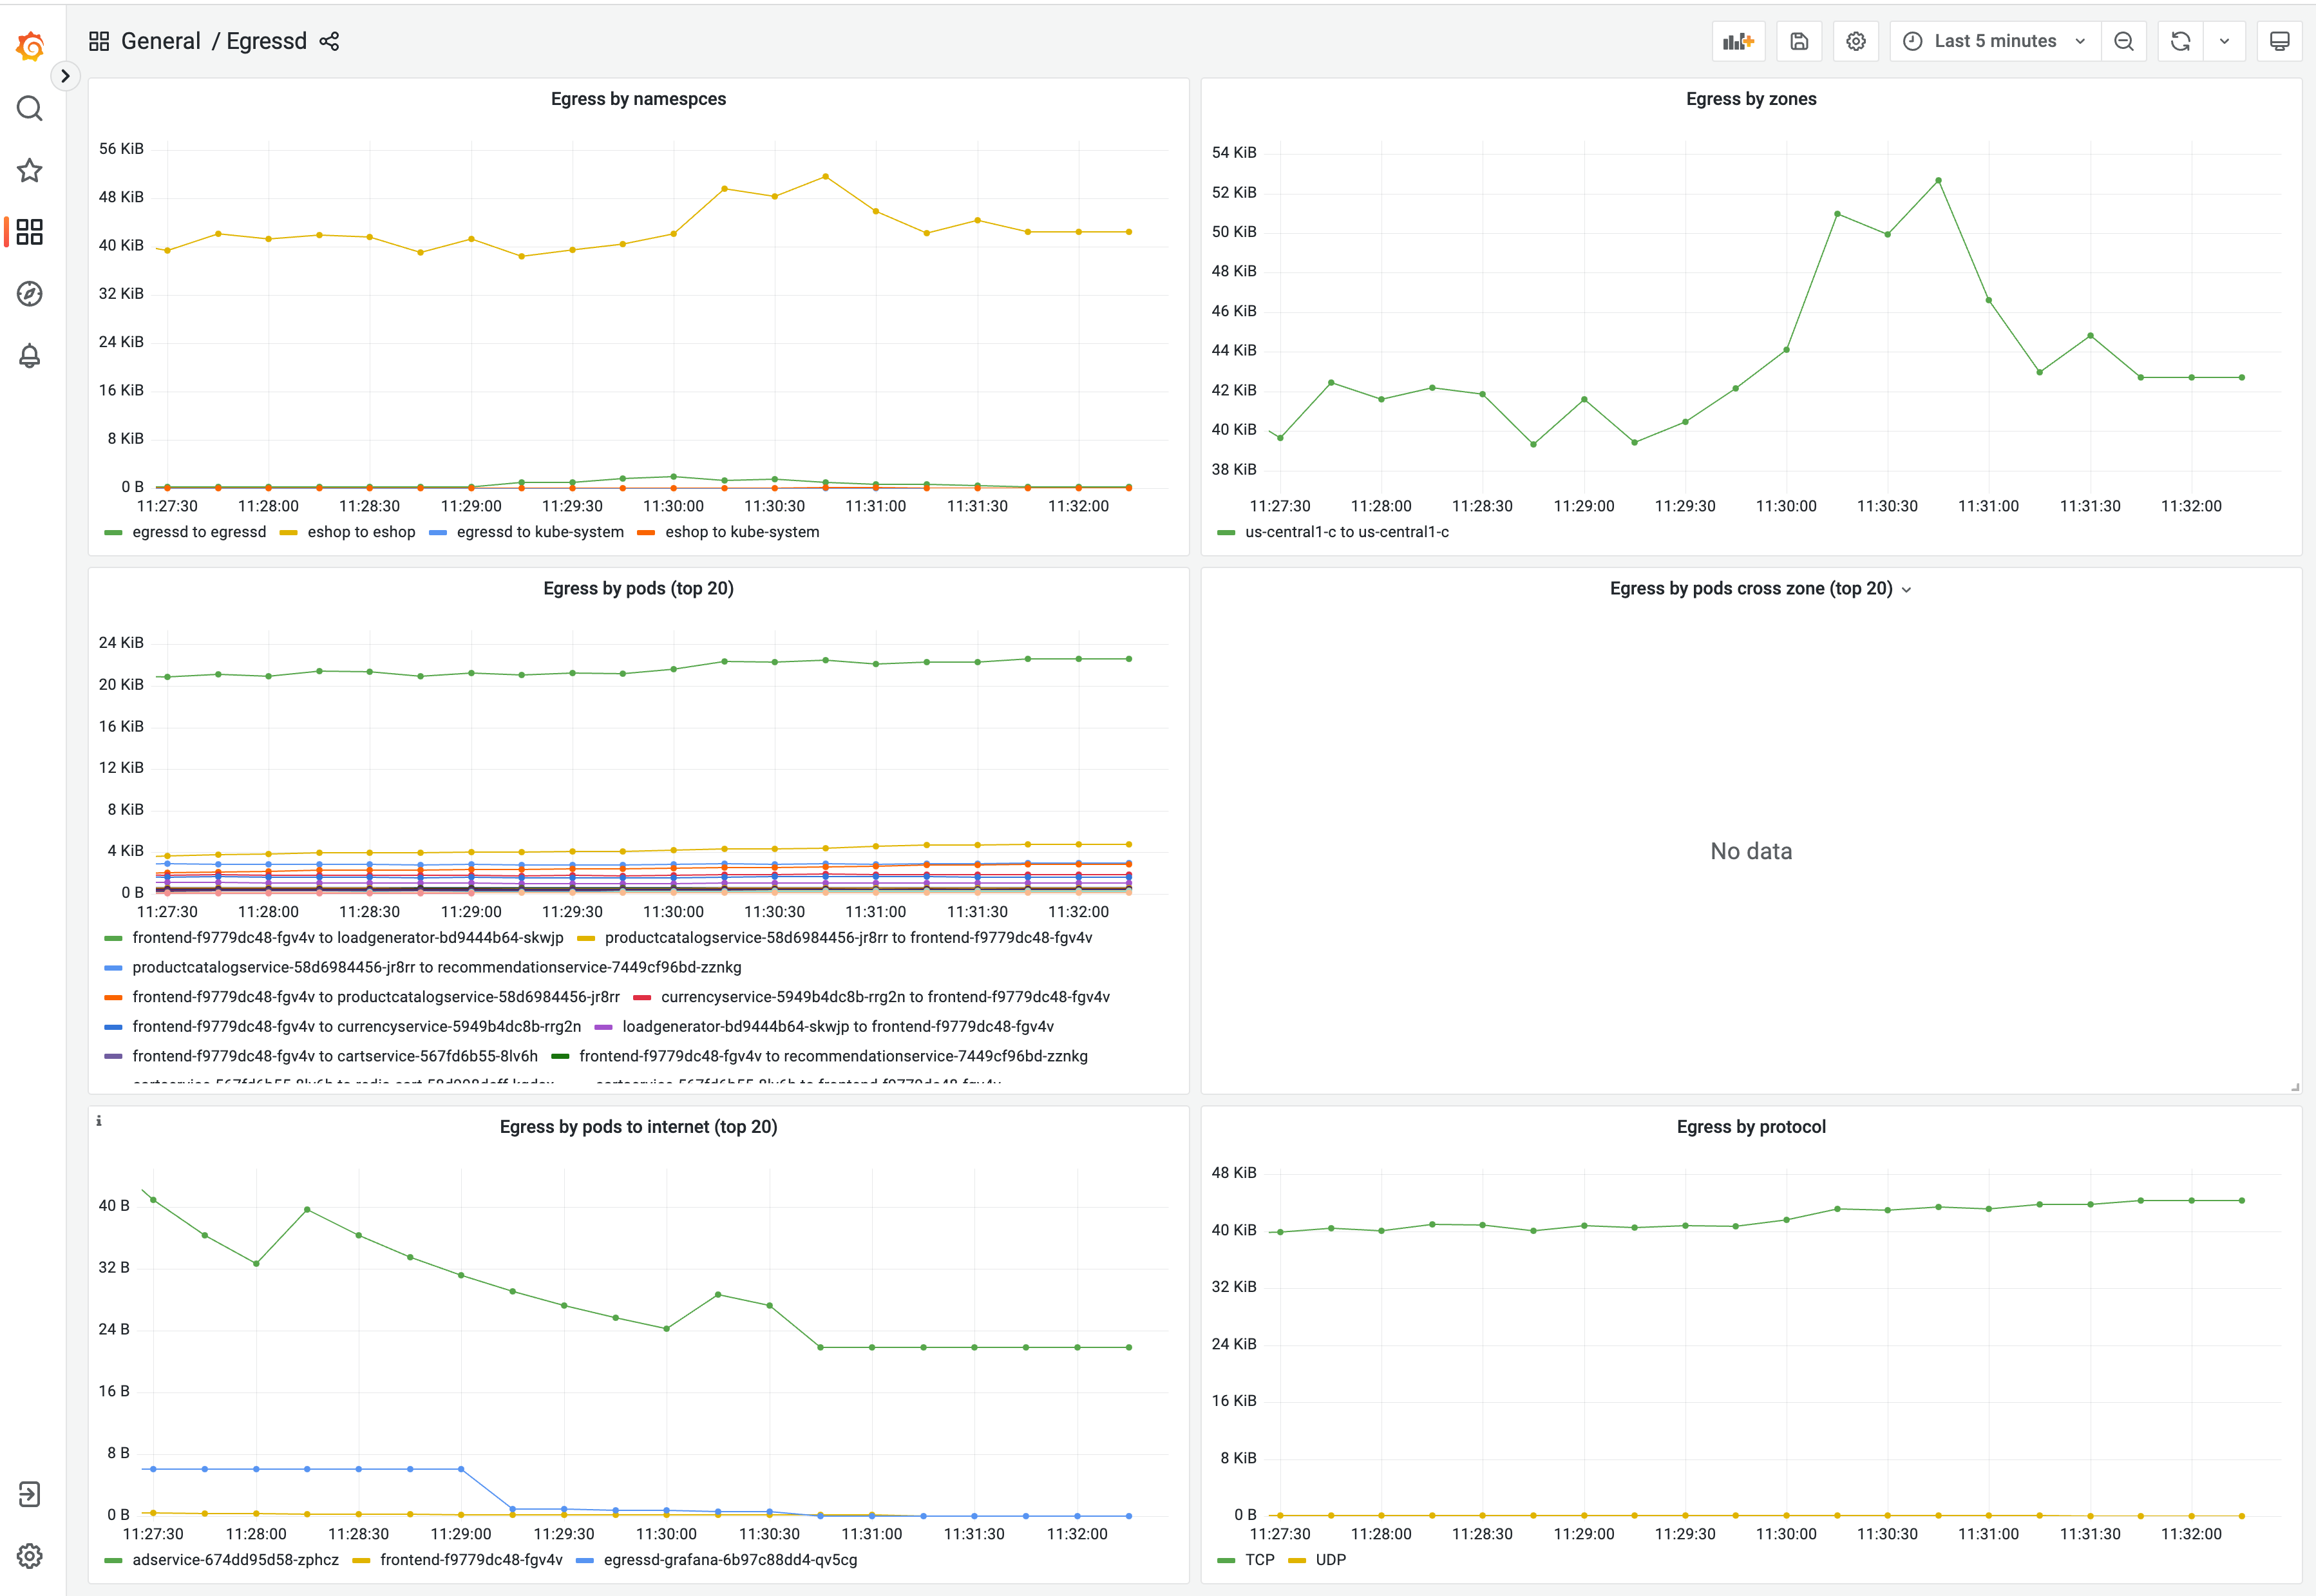
Expose grafana locally
kubectl port-forward svc/egressd-grafana 8080:80 -n egressdExample dashboard available at http://localhost:8080/d/egressd/egressd Metrics should be visible after few minutes.
(Optionally) Install demo onlineboutique eshop
If you want to test egressd on empty cluster.
helm upgrade --install onlineboutique oci://us-docker.pkg.dev/online-boutique-ci/charts/onlineboutique -n demo --create-namespaceStart all components + test grafana,promtheus in tilt local k8s cluster.
tilt up
Head to the GitHub new release page, create a new tag at the top, and click Generate Release Notes at the middle-right.

Run e2e tests locally
KIND_CONTEXT=tilt IMAGE_TAG=local ./e2e/run.sh