###What is PeakDetect? peakdetect.py is a Python script used to detects peaks in timeseries or linear data.
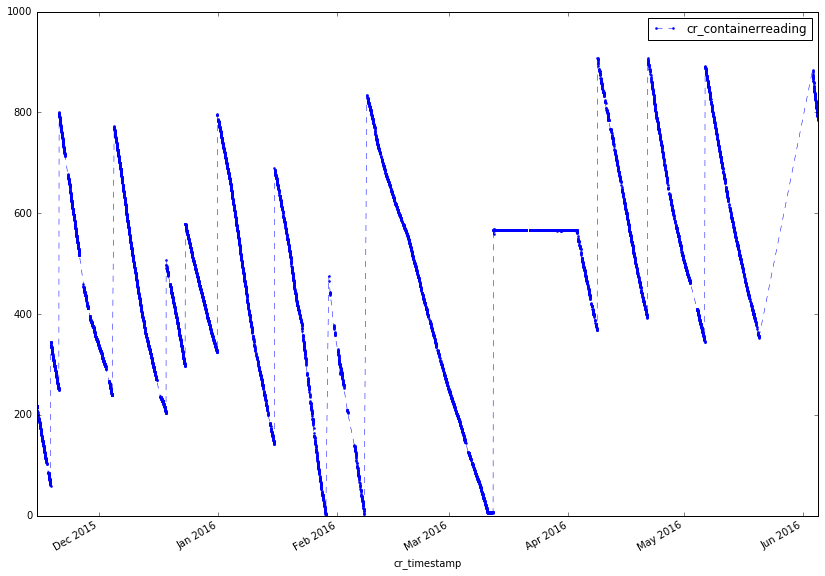
This is input (plotted with Pandas and Matplotlib).

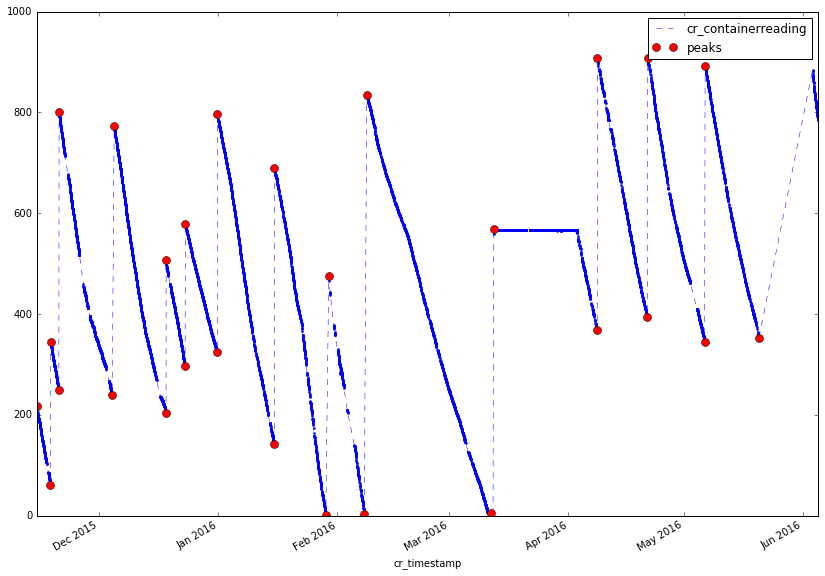
This is output. Maxes and mins were added to the Pandas dataframe and plotted.

###How Can I Use It?
- Order all x-axis values.
- Convert or create data into Numpy array.
- Call peakdetect.py like this.
max_mins = peakdetect(peaks, lookahead=100)
###What is the output?
Peakdetect returns lists of peaks' position and height. See peakdetect script for more details.
max_x, max_y = zip(*max_mins[0])
min_x, min_y = zip(*max_mins[1])
print ("max pos is:", max_x)
print ("max value is:", max_y)
###What is the Source? I think I originally found the script on Github in January 2016. I believe it was based off a MatLab script. However, I can no longer find the original Github repository. I managed to find it here: https://searchcode.com/codesearch/view/68268766/. I don't know if this is the original source. Unfortunately, I'd like to give credit, but I don't know where credit is due.