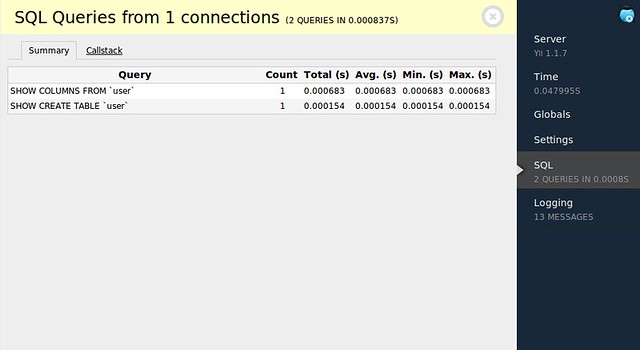
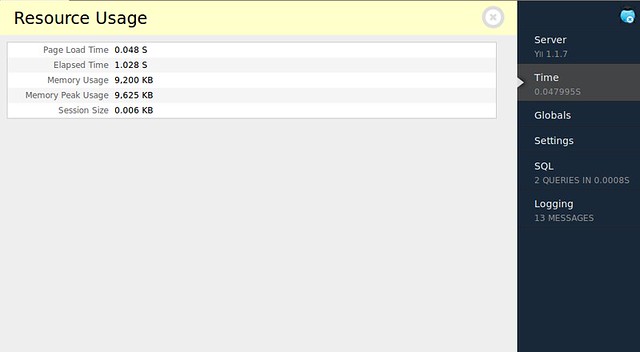
The Yii Debug Toolbar is a configurable set of panels that display various debug information about the current request/response and when clicked, display more details about the panel's content.
It is a ported to PHP famous Django Debug Toolbar.
Currently, the following panels have been written and are working:
- Server info
- Request timer
- A list of superglobals
- Application settings
- SQL queries including time to execute and param bindings
- Logging output via Yii built-in logging
Extract the yii-debug-toolbar from archive under protected/extensions
For use yii-debug-toolbar need to specify new route in log component:
<?php
//...
    'log'=>array(
        'class'=>'CLogRouter',
        'routes'=>array(
            array(
                'class'=>'ext.yii-debug-toolbar.YiiDebugToolbarRoute',
                'ipFilters'=>array('127.0.0.1','192.168.1.215'),
            ),
        ),
),- Make sure your IP is listed in the
ipFilterssetting. If you are working locally this option not required. - Enable Profiling and ParamLogging for all used DB connections.
<?php
//...
	'db'=>array(
	    'connectionString' => 'mysql:host=localhost;dbname=test',
	    //...
	    'enableProfiling'=>true,
	    'enableParamLogging'=>true,
),See: issues

