-
Notifications
You must be signed in to change notification settings - Fork 137
Introduction to Chalktalk
This writeup is a first-time user's guide on how to make sense of ChalkTalk's GUI-less GUI.
First, see the README and the installation directions for installing and starting ChalkTalk.
Chalktalk's interface consists primarily of two conventions:
- Clicking and dragging on the background draws a set of lines, and
- By clicking without dragging, you can activate a series of invisible radial menus. The reason they're invisible is because of Chalktalk's use in presentations: the focus should be on the content you're showing instead of the interface.
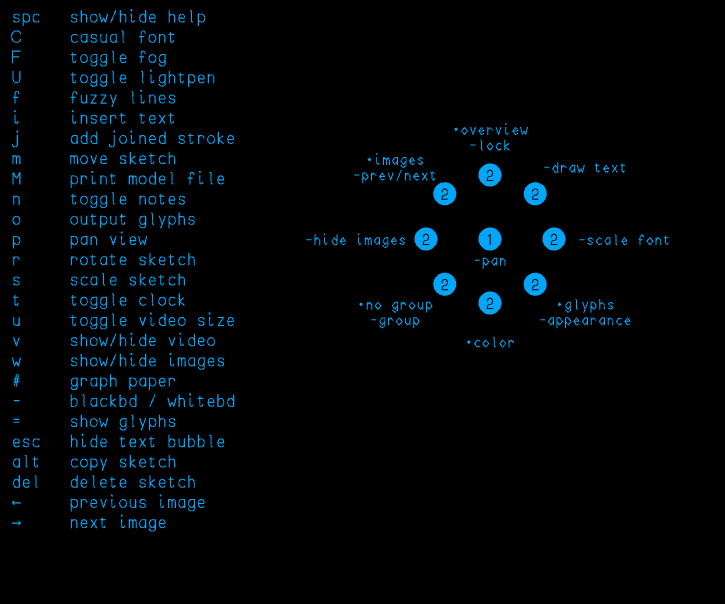
However, as a helpful tool for beginners, pressing Space activates "help mode", which makes these radial menus visible.

Try pressing Space and hovering over the background. You'll see a radial menu of possible commands. These options are accessed by clicking once, moving the mouse in the given direction, and clicking again. Most of ChalkTalk's commands can be accessed by this kind of click-move-click action.
For example, to zoom out on the whole ChalkTalk space, you can click once on the background, move the mouse up, and (while on empty space) click again.
Now try drawing a known object. Draw a square in two strokes: first starting on the bottom-left and going right and up, then starting a second stroke and going left and down.

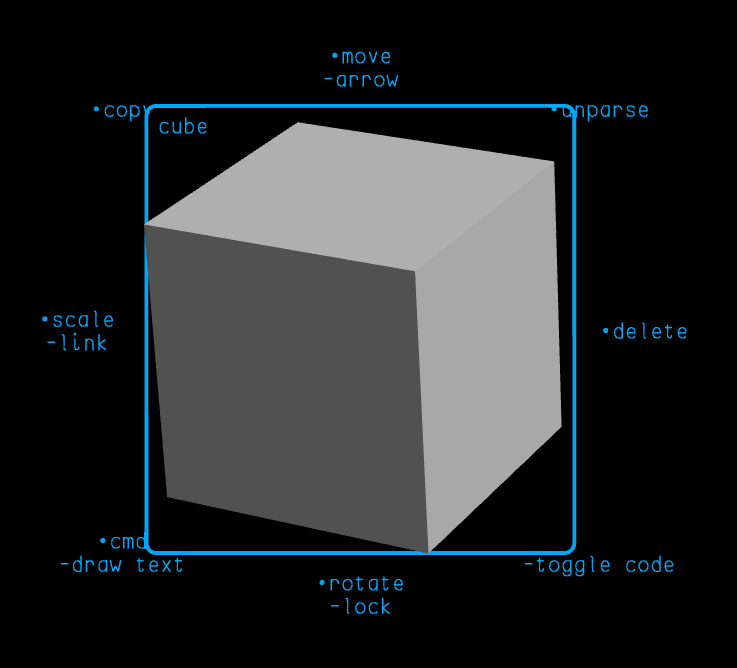
Then click once in the middle of your square. It should morph into a perfect-looking square. Your sketch has now been recognized as a Cube.

Okay, so let's actually prove that it's a cube. Hold down the 'r' key while you have the mouse cursor over the square, then move the mouse. You should now see the square rotate around to show a 3D cube.

There are keyboard commands for rotate, scale, translate, and more, but we can do all of this with just the mouse. Hold down Space over the cube to bring up the quick help menu.

All of the options shown for the cube are done with a click-move-click action again, but this time you'll click outside the cube in the given direction and then click on the cube itself. Try it for rotation - click below the cube once, then click on the cube, then move the mouse. (Note that you need to just click on the cube, not click-and-drag.)
Some smart objects will have more commands listed that are accessed by
dragging the mouse, or by using the 'cmd' modifier. Let's try one of
those now on a bar chart. First, bring up the dictionary of smart
objects by pressing =.

What you're seeing here is a list of every sketch that Chalktalk currently has loaded. Look near the bottom-middle of the list for
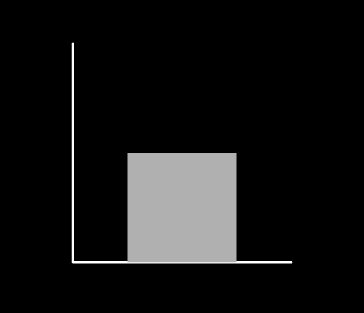
barchart. Click and drag it to create one, then click on the resulting
sketch to bring it to life.

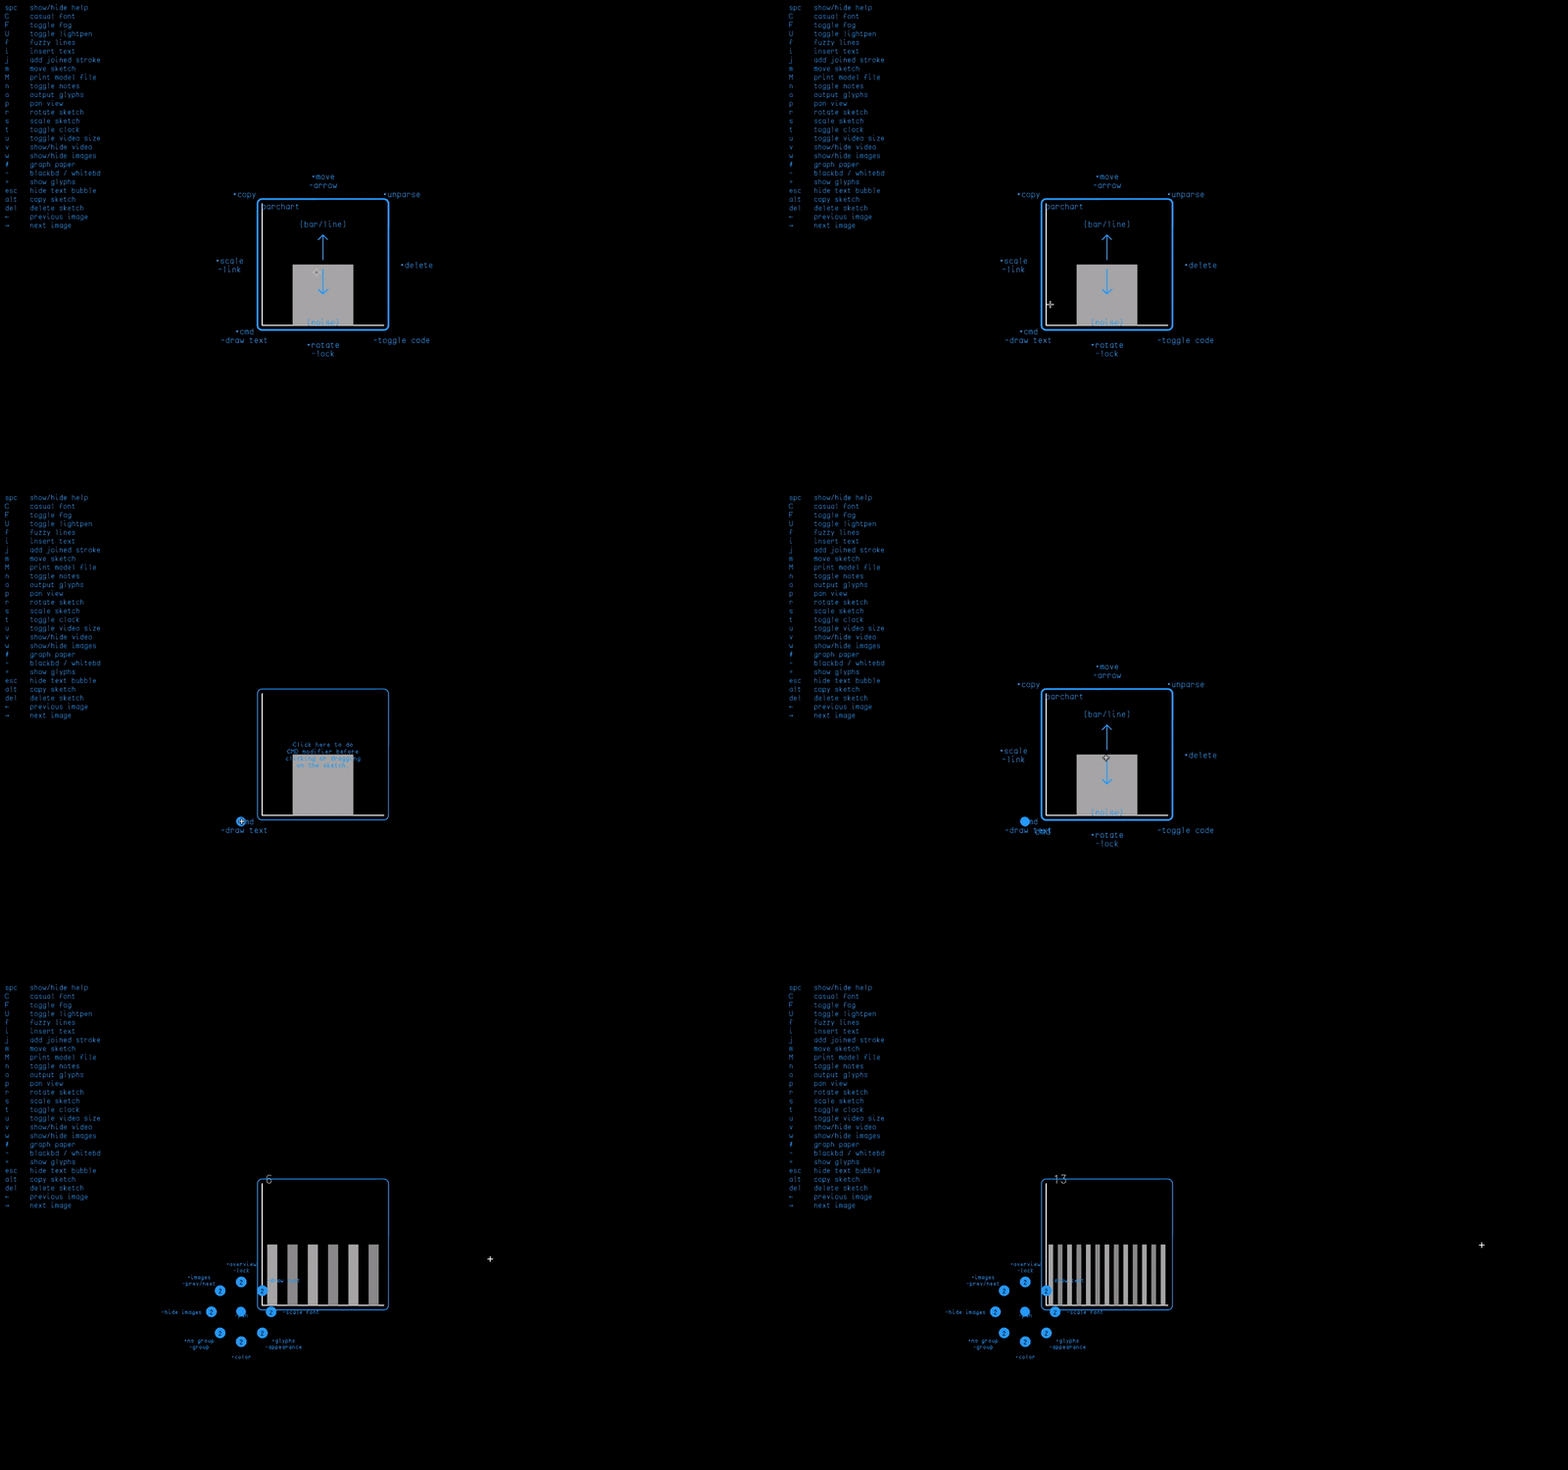
This gives us a nice one-bar chart, but usually the point of a bar chart is to have more than one value. Hold Space over the bar chart to see the list of commands available. You'll see 'cmd' to the bottom-left. The bar chart has a "Cmd-drag horizontally" feature to create additional bars. (It isn't listed here, but it's mentioned in the source code for the object, which you can access by doing a click-move-drag action from the bottom-right.) Cmd-drag is done by doing a click-move-drag: click once below-and-left of the bar chart, then click-and-drag on the bar chart and drag to the right. Voila! Lots of bars.

The bar chart can also be just clicked-and-dragged normally to adjust the values of the bars.
Smart objects are great, but what really makes them powerful is that we can hook them together. Let's try that with our new bar chart. Find 'face' in the list of smart objects and create one. (You might want to move objects around so that the face is beside the bar chart.) Click on the face so that it's activated. This face can actually be controlled by sending it numeric values, which it uses to change expressive features such as the eyebrow position, mouth shape, etc.
To connect the bar chart's output to the face's input, click to the
left of the bar chart and then click-and-drag from the middle of the
bar chart outwards. You should see a curved line appear that follows
your mouse out from the chart. Drag it over to the middle of the face
and then let go. There should now be an arrow with an x in the
middle from the chart to the face. Now try dragging the bars to
adjust their heights. Make a face!

For the grand finale, there's one more handy feature hiding inside the bar chart object. Make sure you have at least twelve bars in your bar chart, and then do a Cmd-drag-down action on the bar chart to activate the built-in noise function feature. Enjoy!