This is a SmartThings device type handler (henceforth 'DTH') for the Enphase Envoy solar monitoring device. This repository also contains a similar DTH that I adapted for SolarEdge PV Monitoring Portal inverters (please note that my testing for that driver is extremely limited as I don't have such a system - this thread in the ST community forums is probably the best place to talk about the SolarEdge DTH).
This DTH directly accesses the Envoy via its local LAN address to query for the latest data (please note that I have not tested this with an Envoy-S so I don't know whether it works for those devices or not). The DTH supports both Envoy software release 3.9 or later (which supports retrieving JSON data for the production at http://IP/api/v1/production) as well as older firmware lacking the JSON API. The DTH will automatically detect whether the JSON API is available and otherwise fall back to parsing the Envoy's HTML output (please note that the data resolution for the HTML pages is slightly less accurate and that you will only start to get data after the second refresh for those devices).
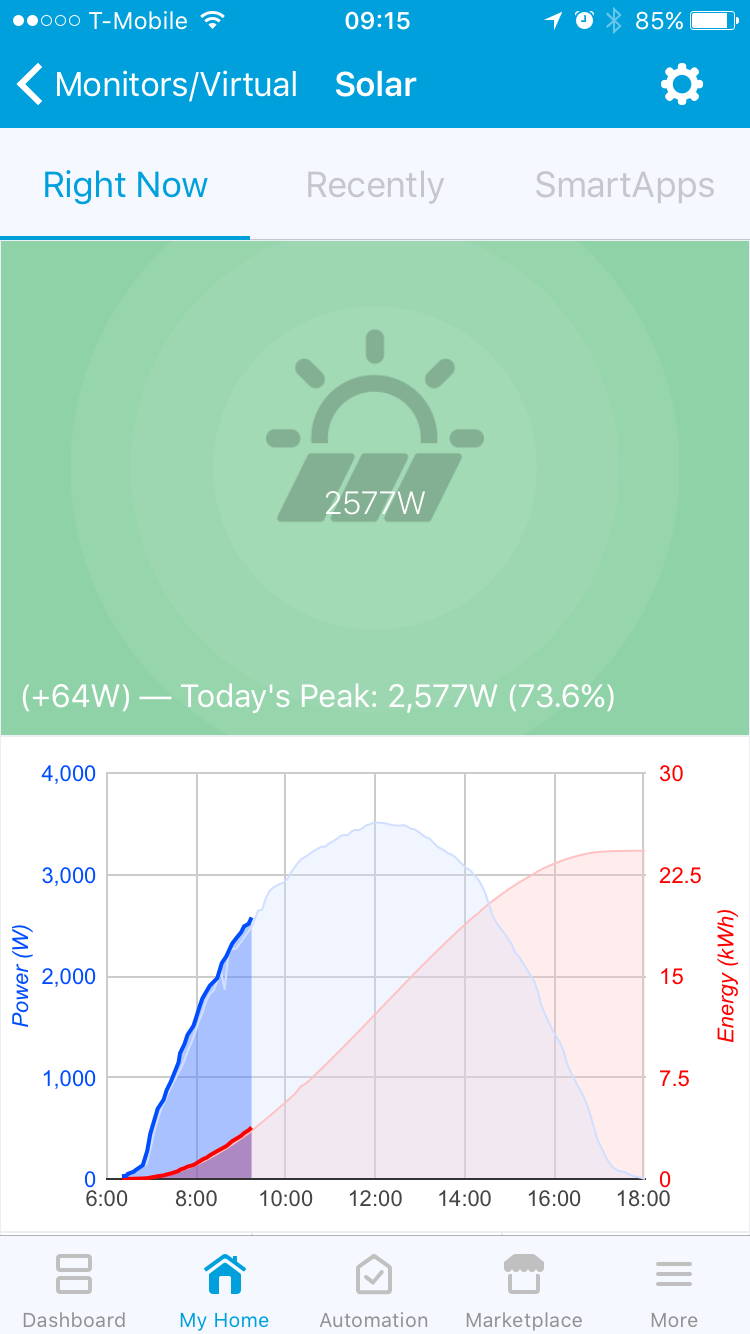
The DTH shows the latest data from the device (current power, change since last reading, peak reading for the day) in the top tile as well as a chart for the data of the last two days (power in blue with units on the left axis, energy in red with units on the right axis; yesterday's data is using fainter colors). Data is only available from the first installation of the DTH so yesteday's data will not be available until the second day using it.
Note: The graph display uses a currently undocumented feature in the SmartThings mobile application which most likely will change in the future. I will try my best to keep the graph available but can't make any promises as server-side changes are beyond my control.
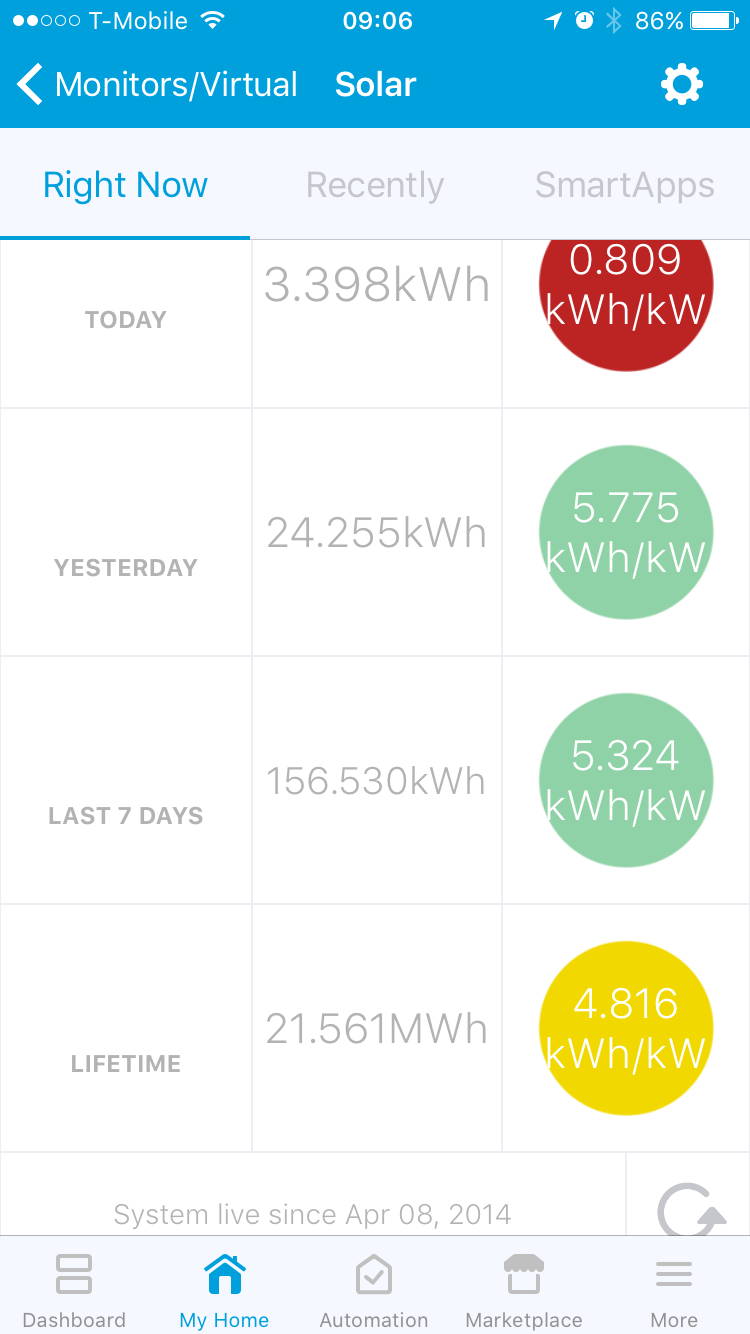
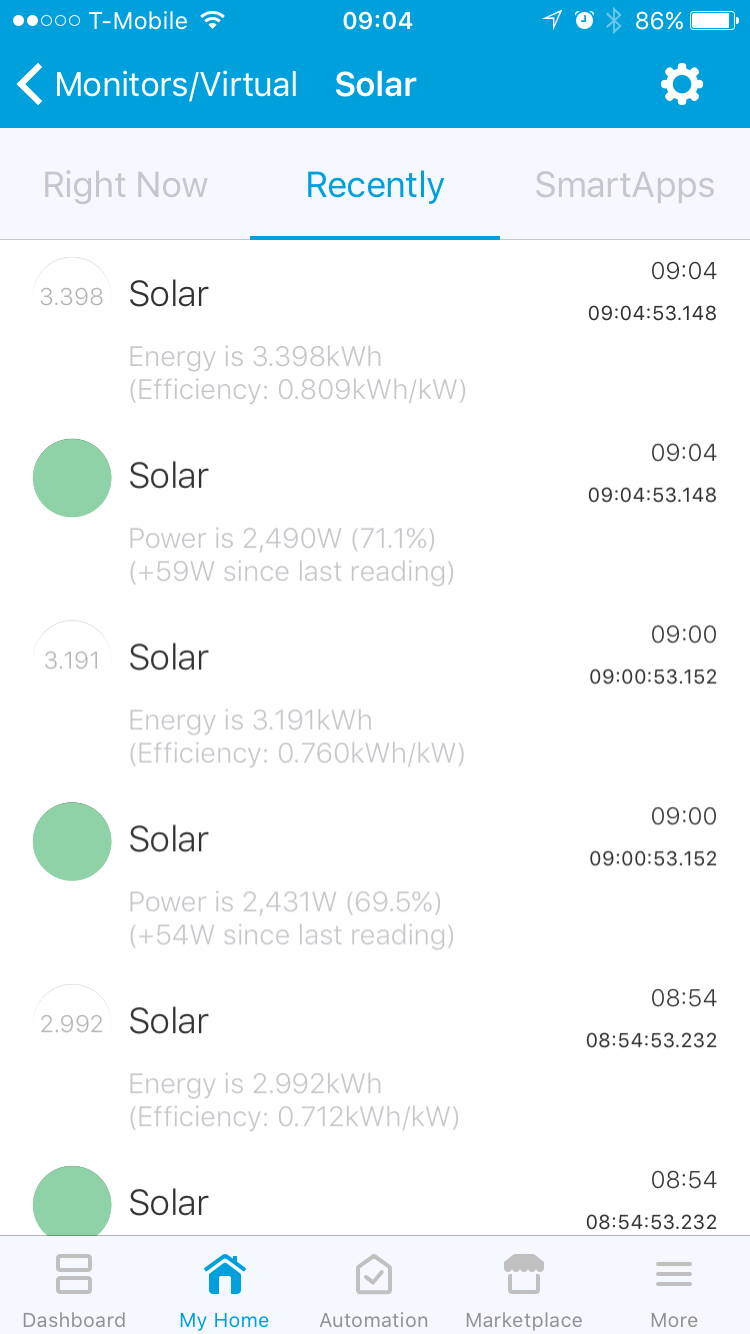
The following screen shots are from the Envoy DTH using SmartThings app version 2.1.3 on iOS on iPhone 6. The SolarEdge version looks very similar but the data tiles show different time periods (today/yesterday/last month/last year/lifetime):
The tiles below the chart show the total energy production for today, yesterday, the last 7 days, and system lifetime in the middle column and the efficiency for the same time spans in the right column. Efficiency is calculated by dividing the total energy output (kWh) by the system size (kW). The efficiency measure allows the outputs of system with different sizes to be compared. The value corresponds to number of hours of full production of the system - expected values depend on location and array orientation.
Please see this FAQ in the SmartThings Community for instructions on how to install the device handler to your ST account.


