By installing a local Kibana dashboard on your own computer, you can now easily analyze Cloudflare ELS logs / logshare and even origin web server logs e.g. Apache web access logs for troubleshooting issues.
- import CF ELS logs into Elasticsearch to easily analyze the data
- import Apache web access logs to examine requests hitting the origin web server
-
install git https://git-scm.com/downloads
-
install Virtualbox https://www.virtualbox.org/wiki/Downloads
-
install Vagrant https://www.vagrantup.com/downloads.html
Open a Terminal and run the following commands as shown below.
git clone https://github.com/marknismo/vagrant-elk.git
cd vagrant-elk
vagrant up

- optional:
Modify the file Vagrantfile and adjust the memory size to allocate the Virtual machine depending on how much memory your computer has (e.g. half of your computer memory). e.g. "--memory", "4086"
Start the Virtual machine
cd vagrant-elk
vagrant up
Place your log files in the vagrant shared folder

cd ~/vagrant-elk/elasticshare/els
Place CF ELS logs in vagrant-elk/elasticshare/els
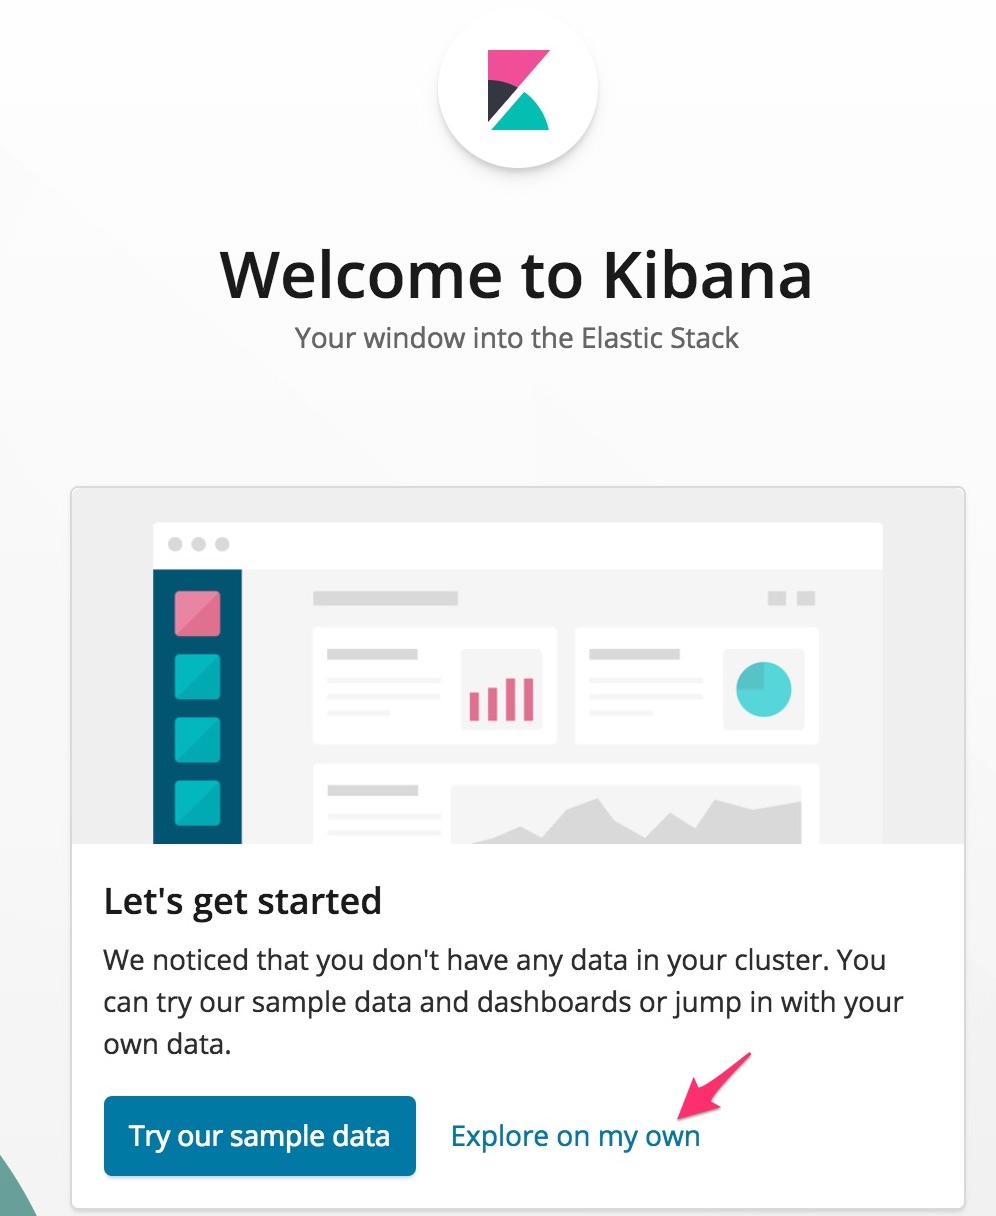
On the web browser > go to http://127.0.0.1:5601
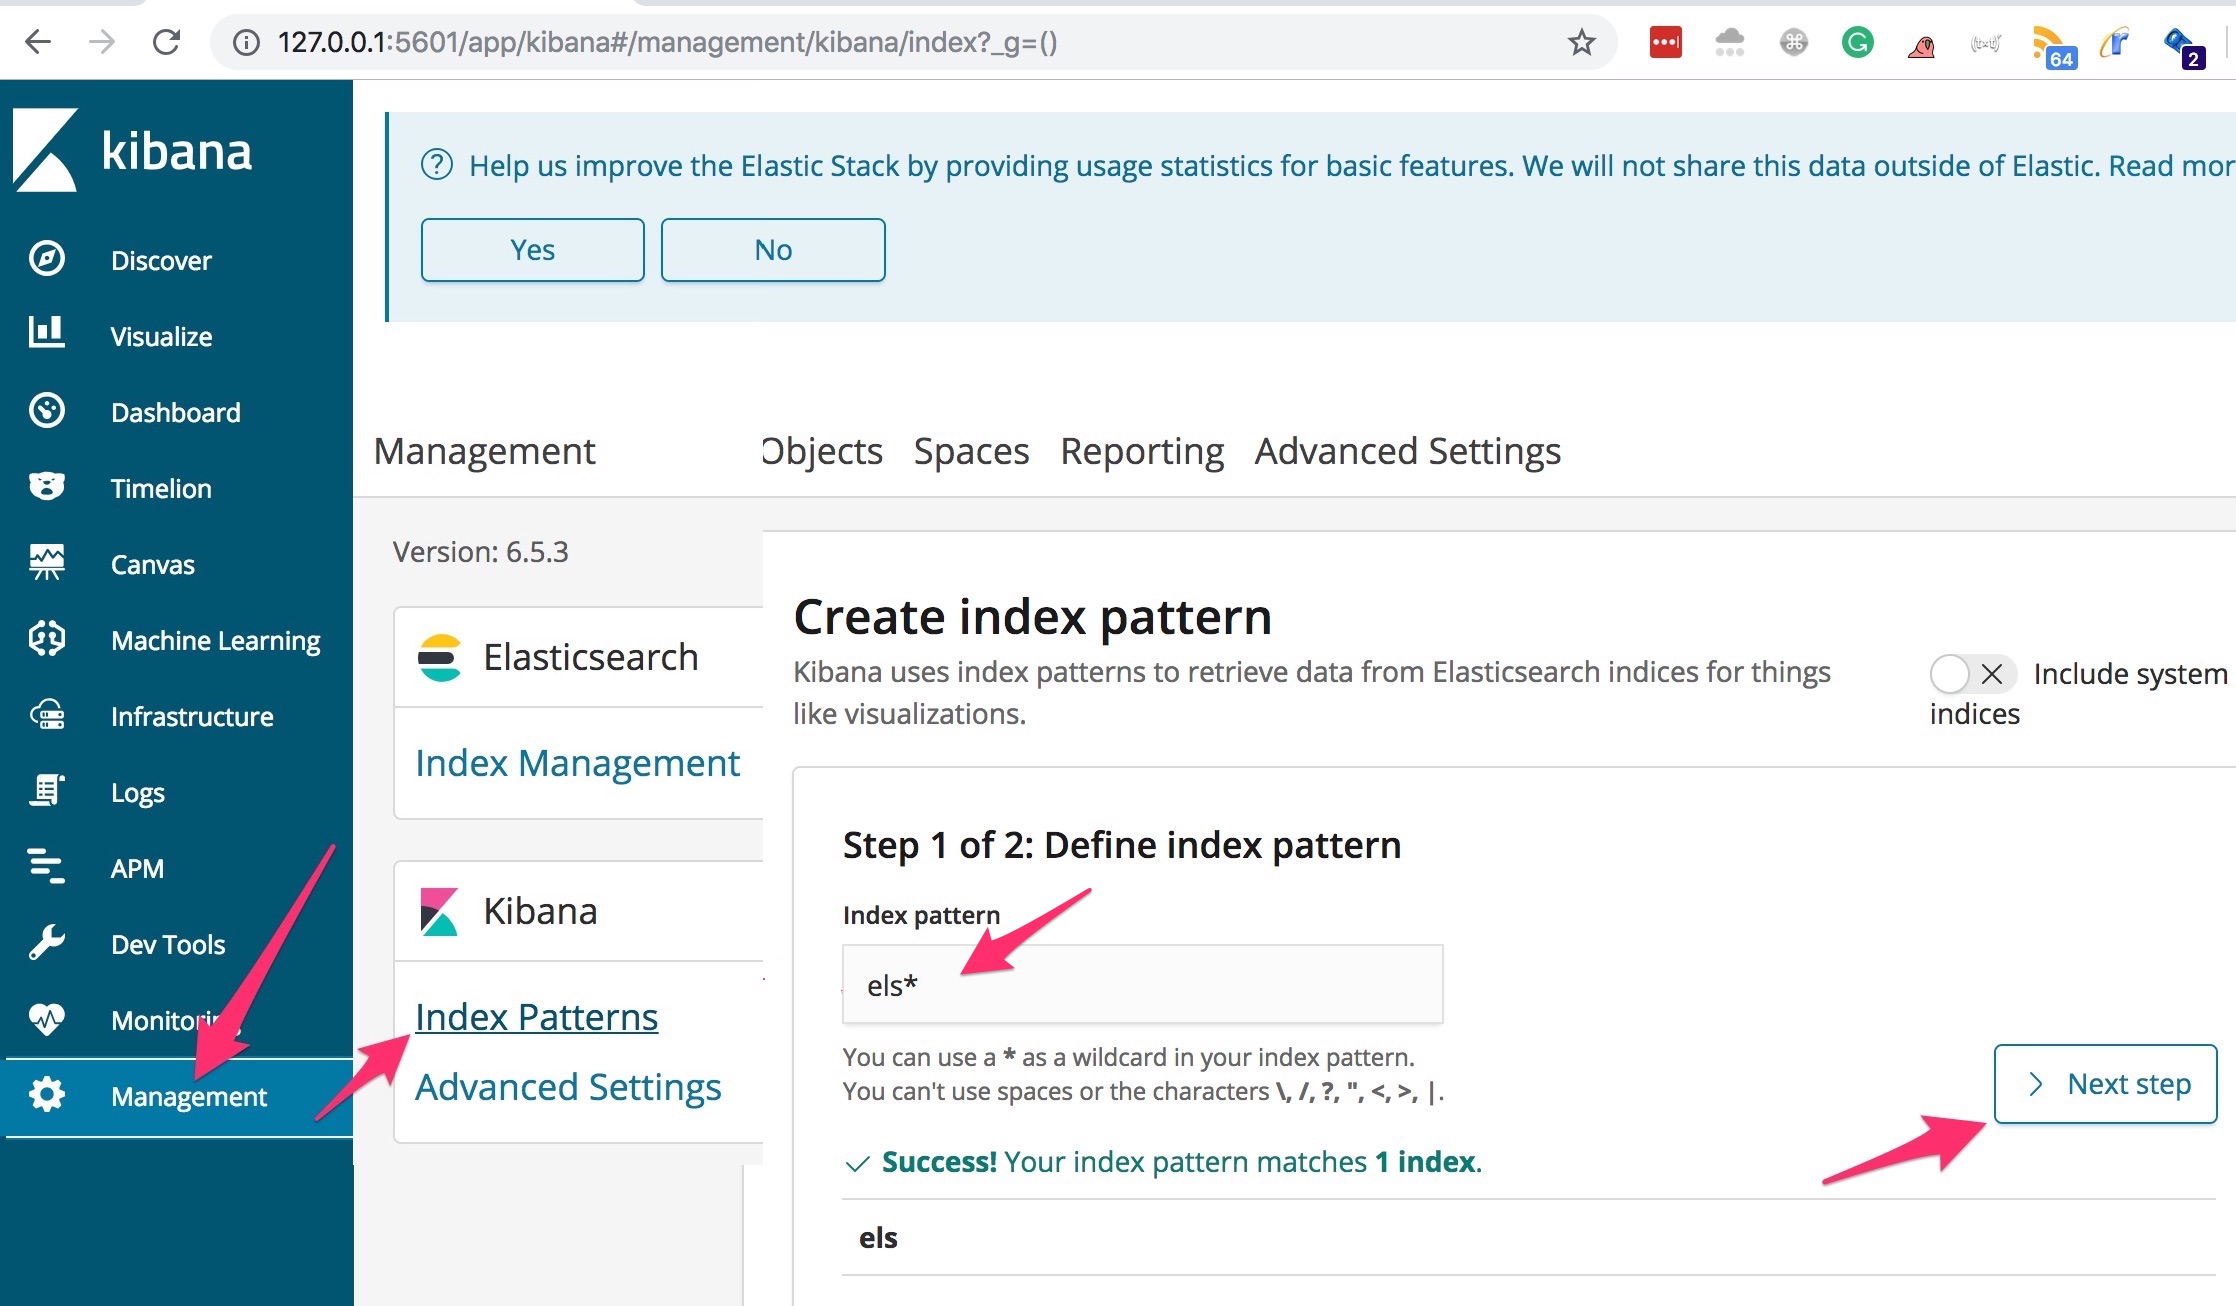
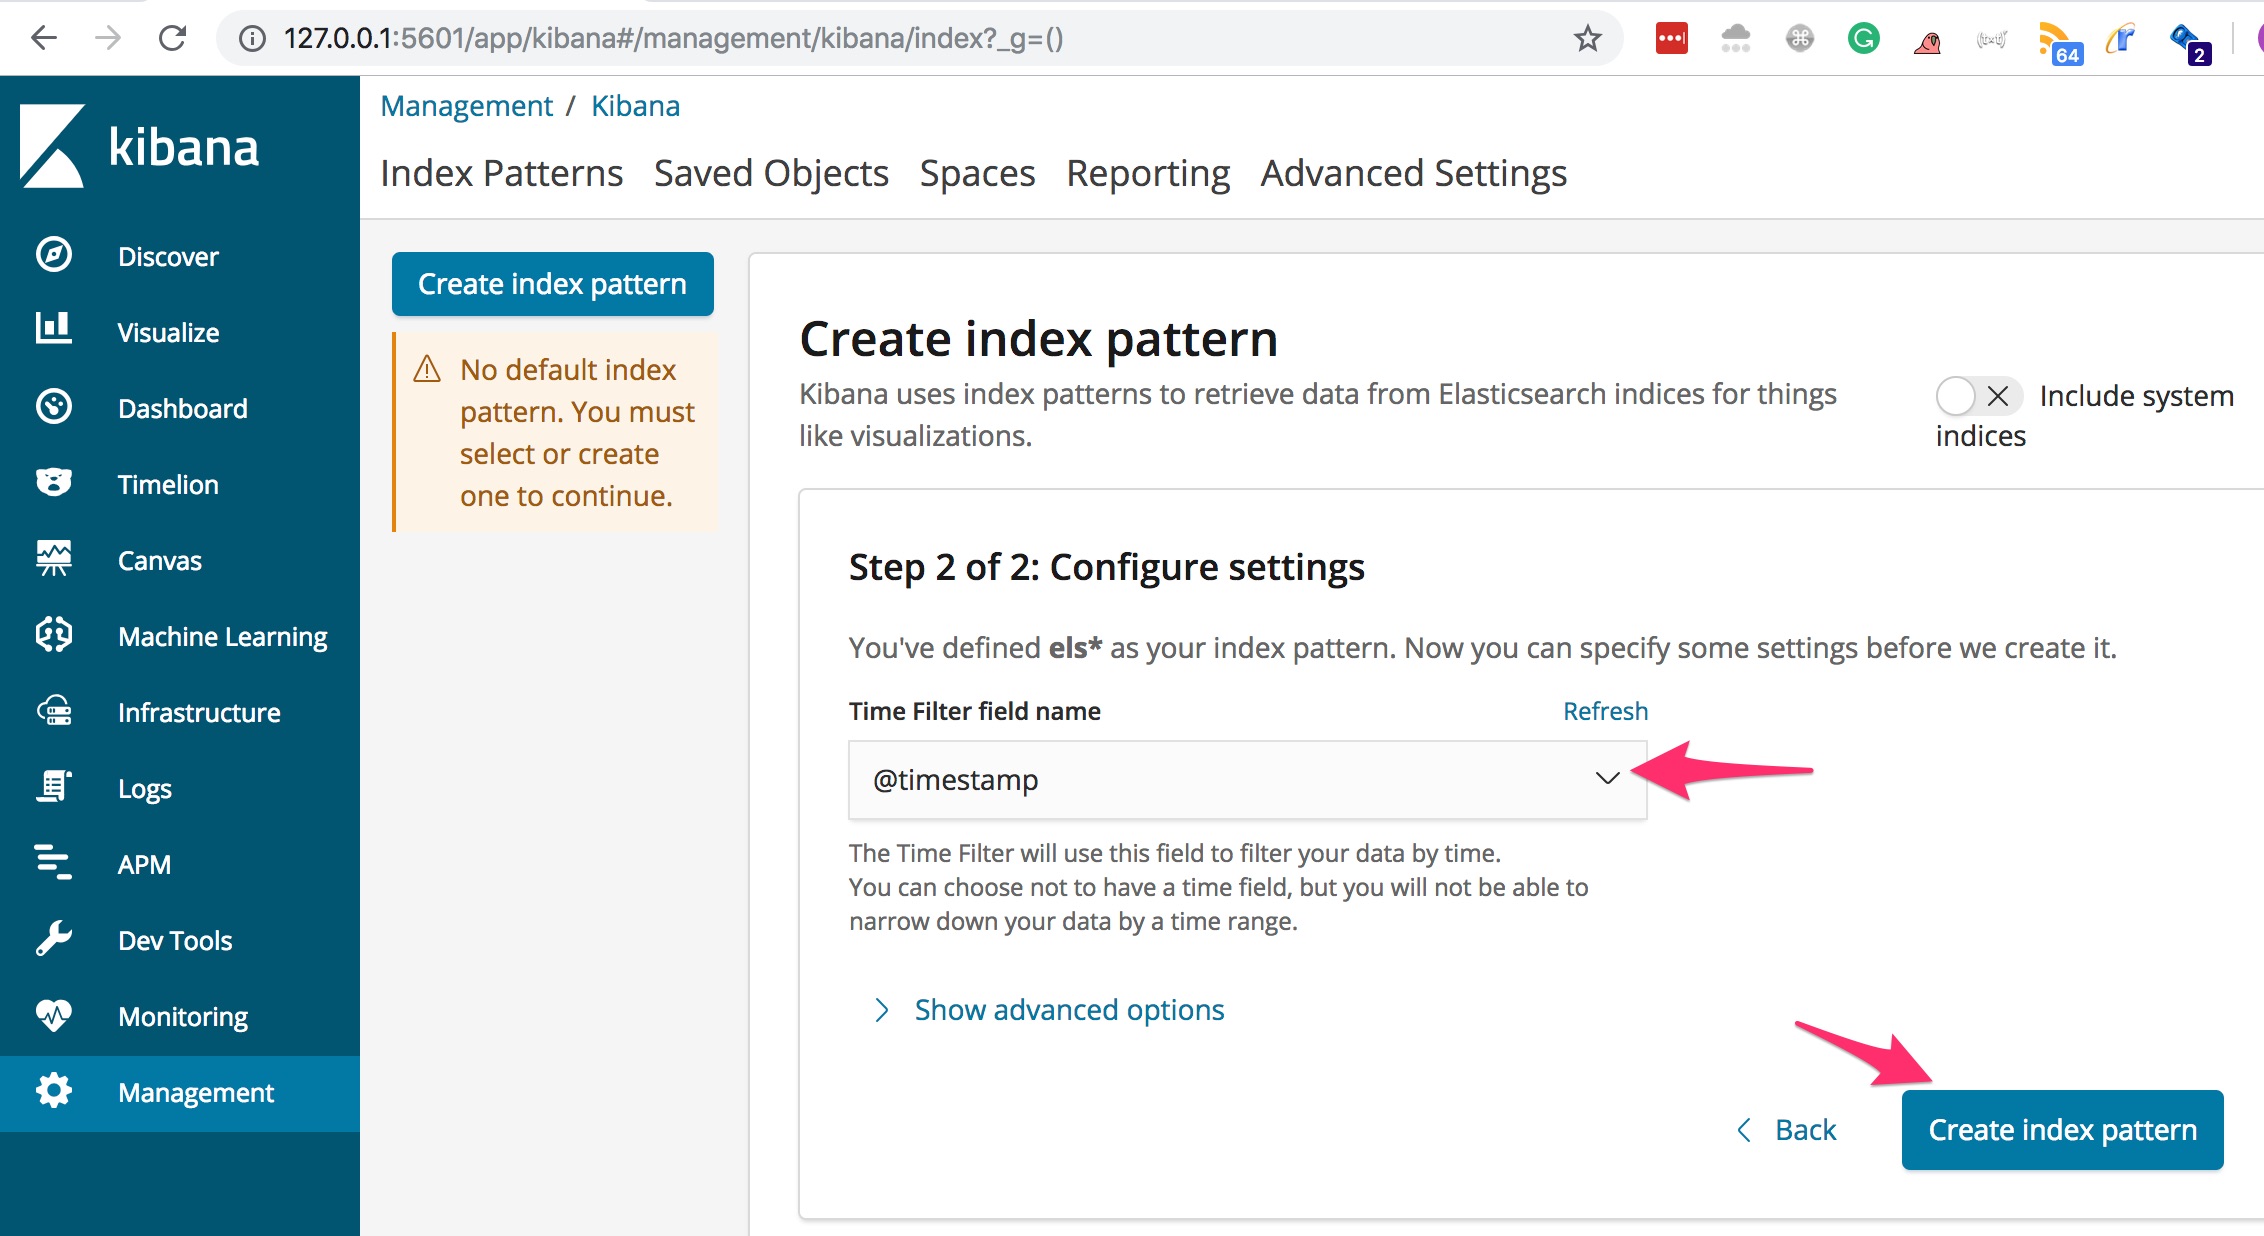
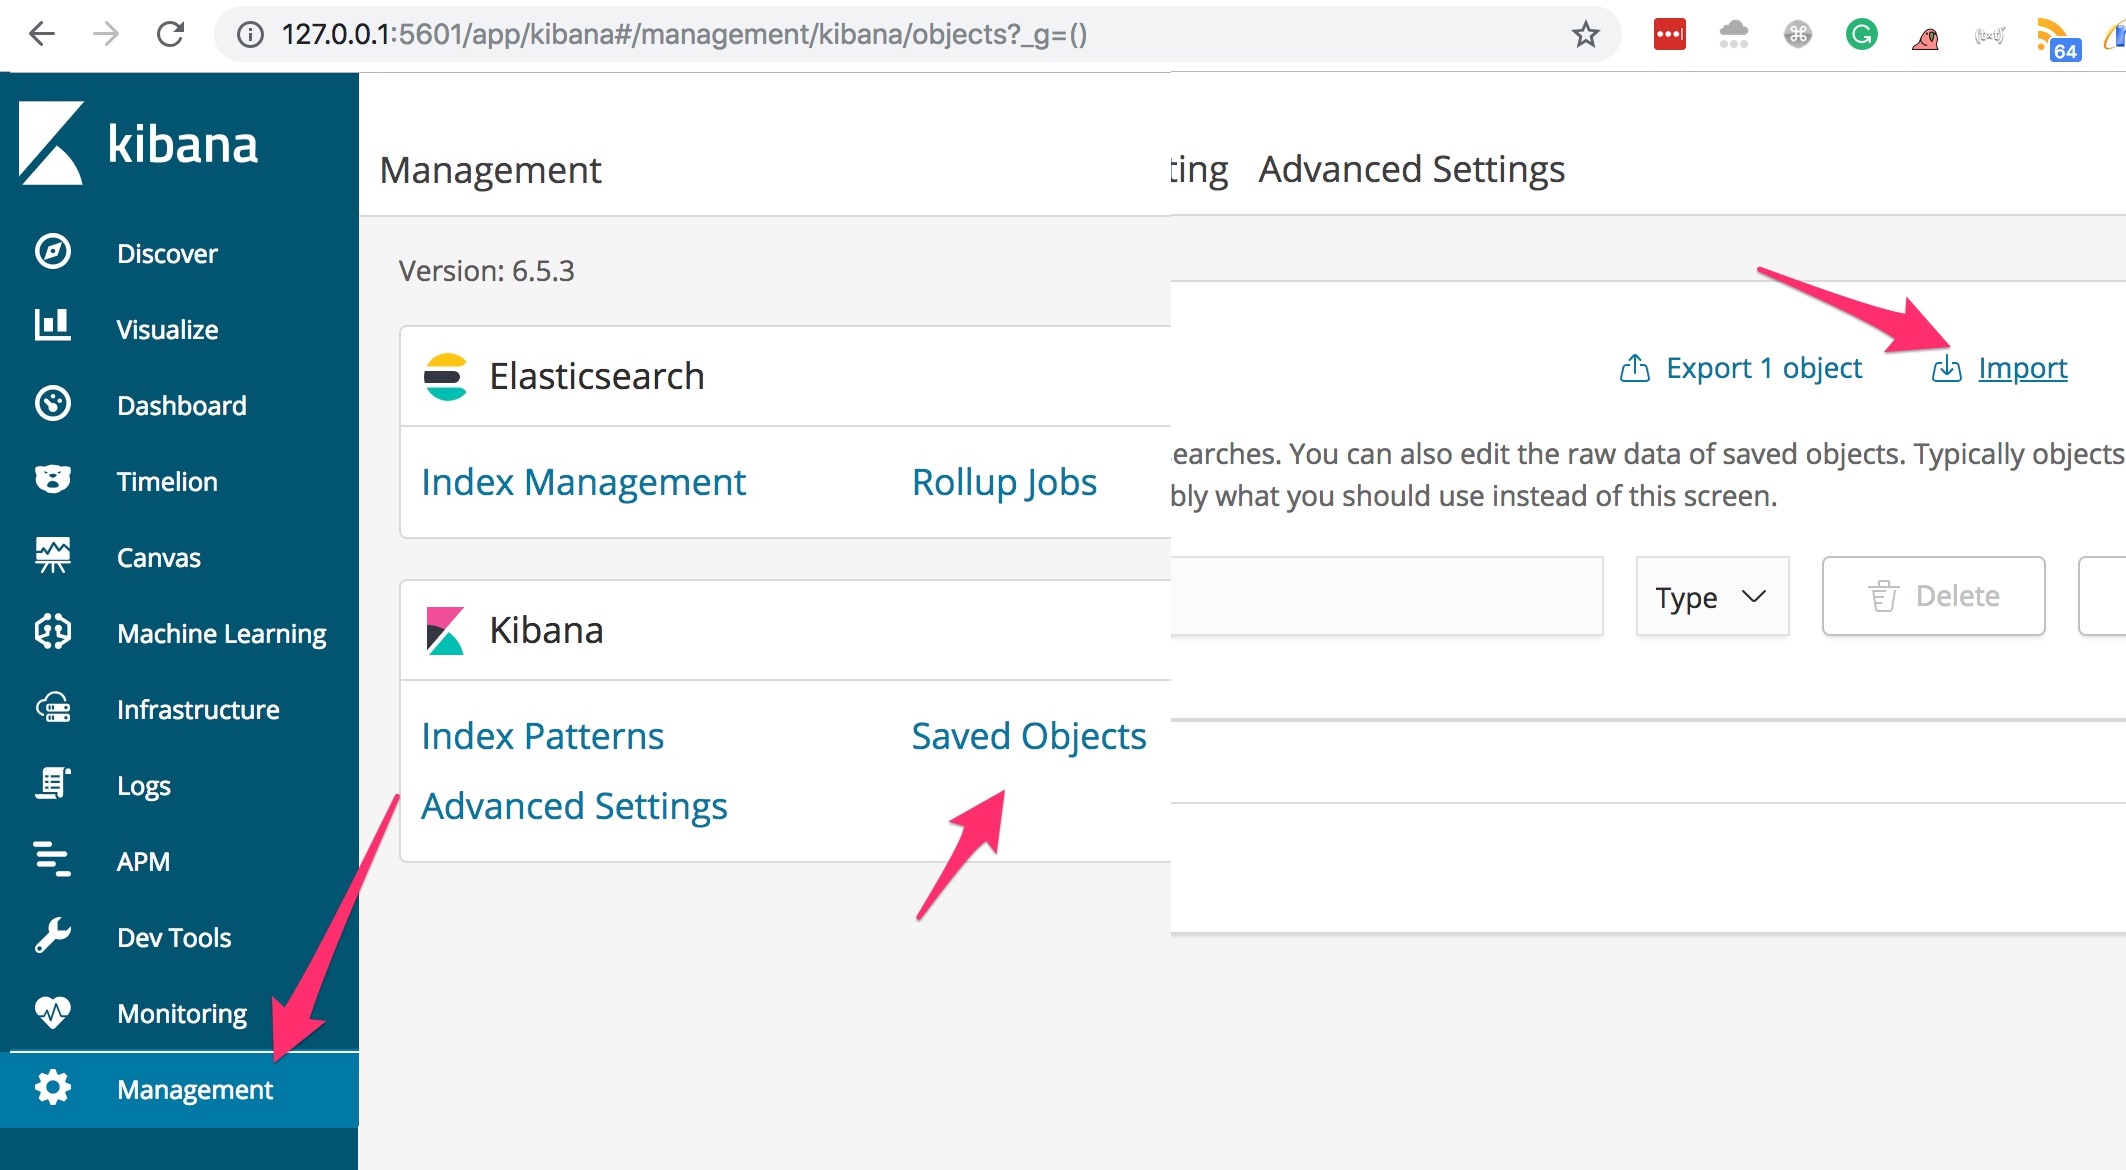
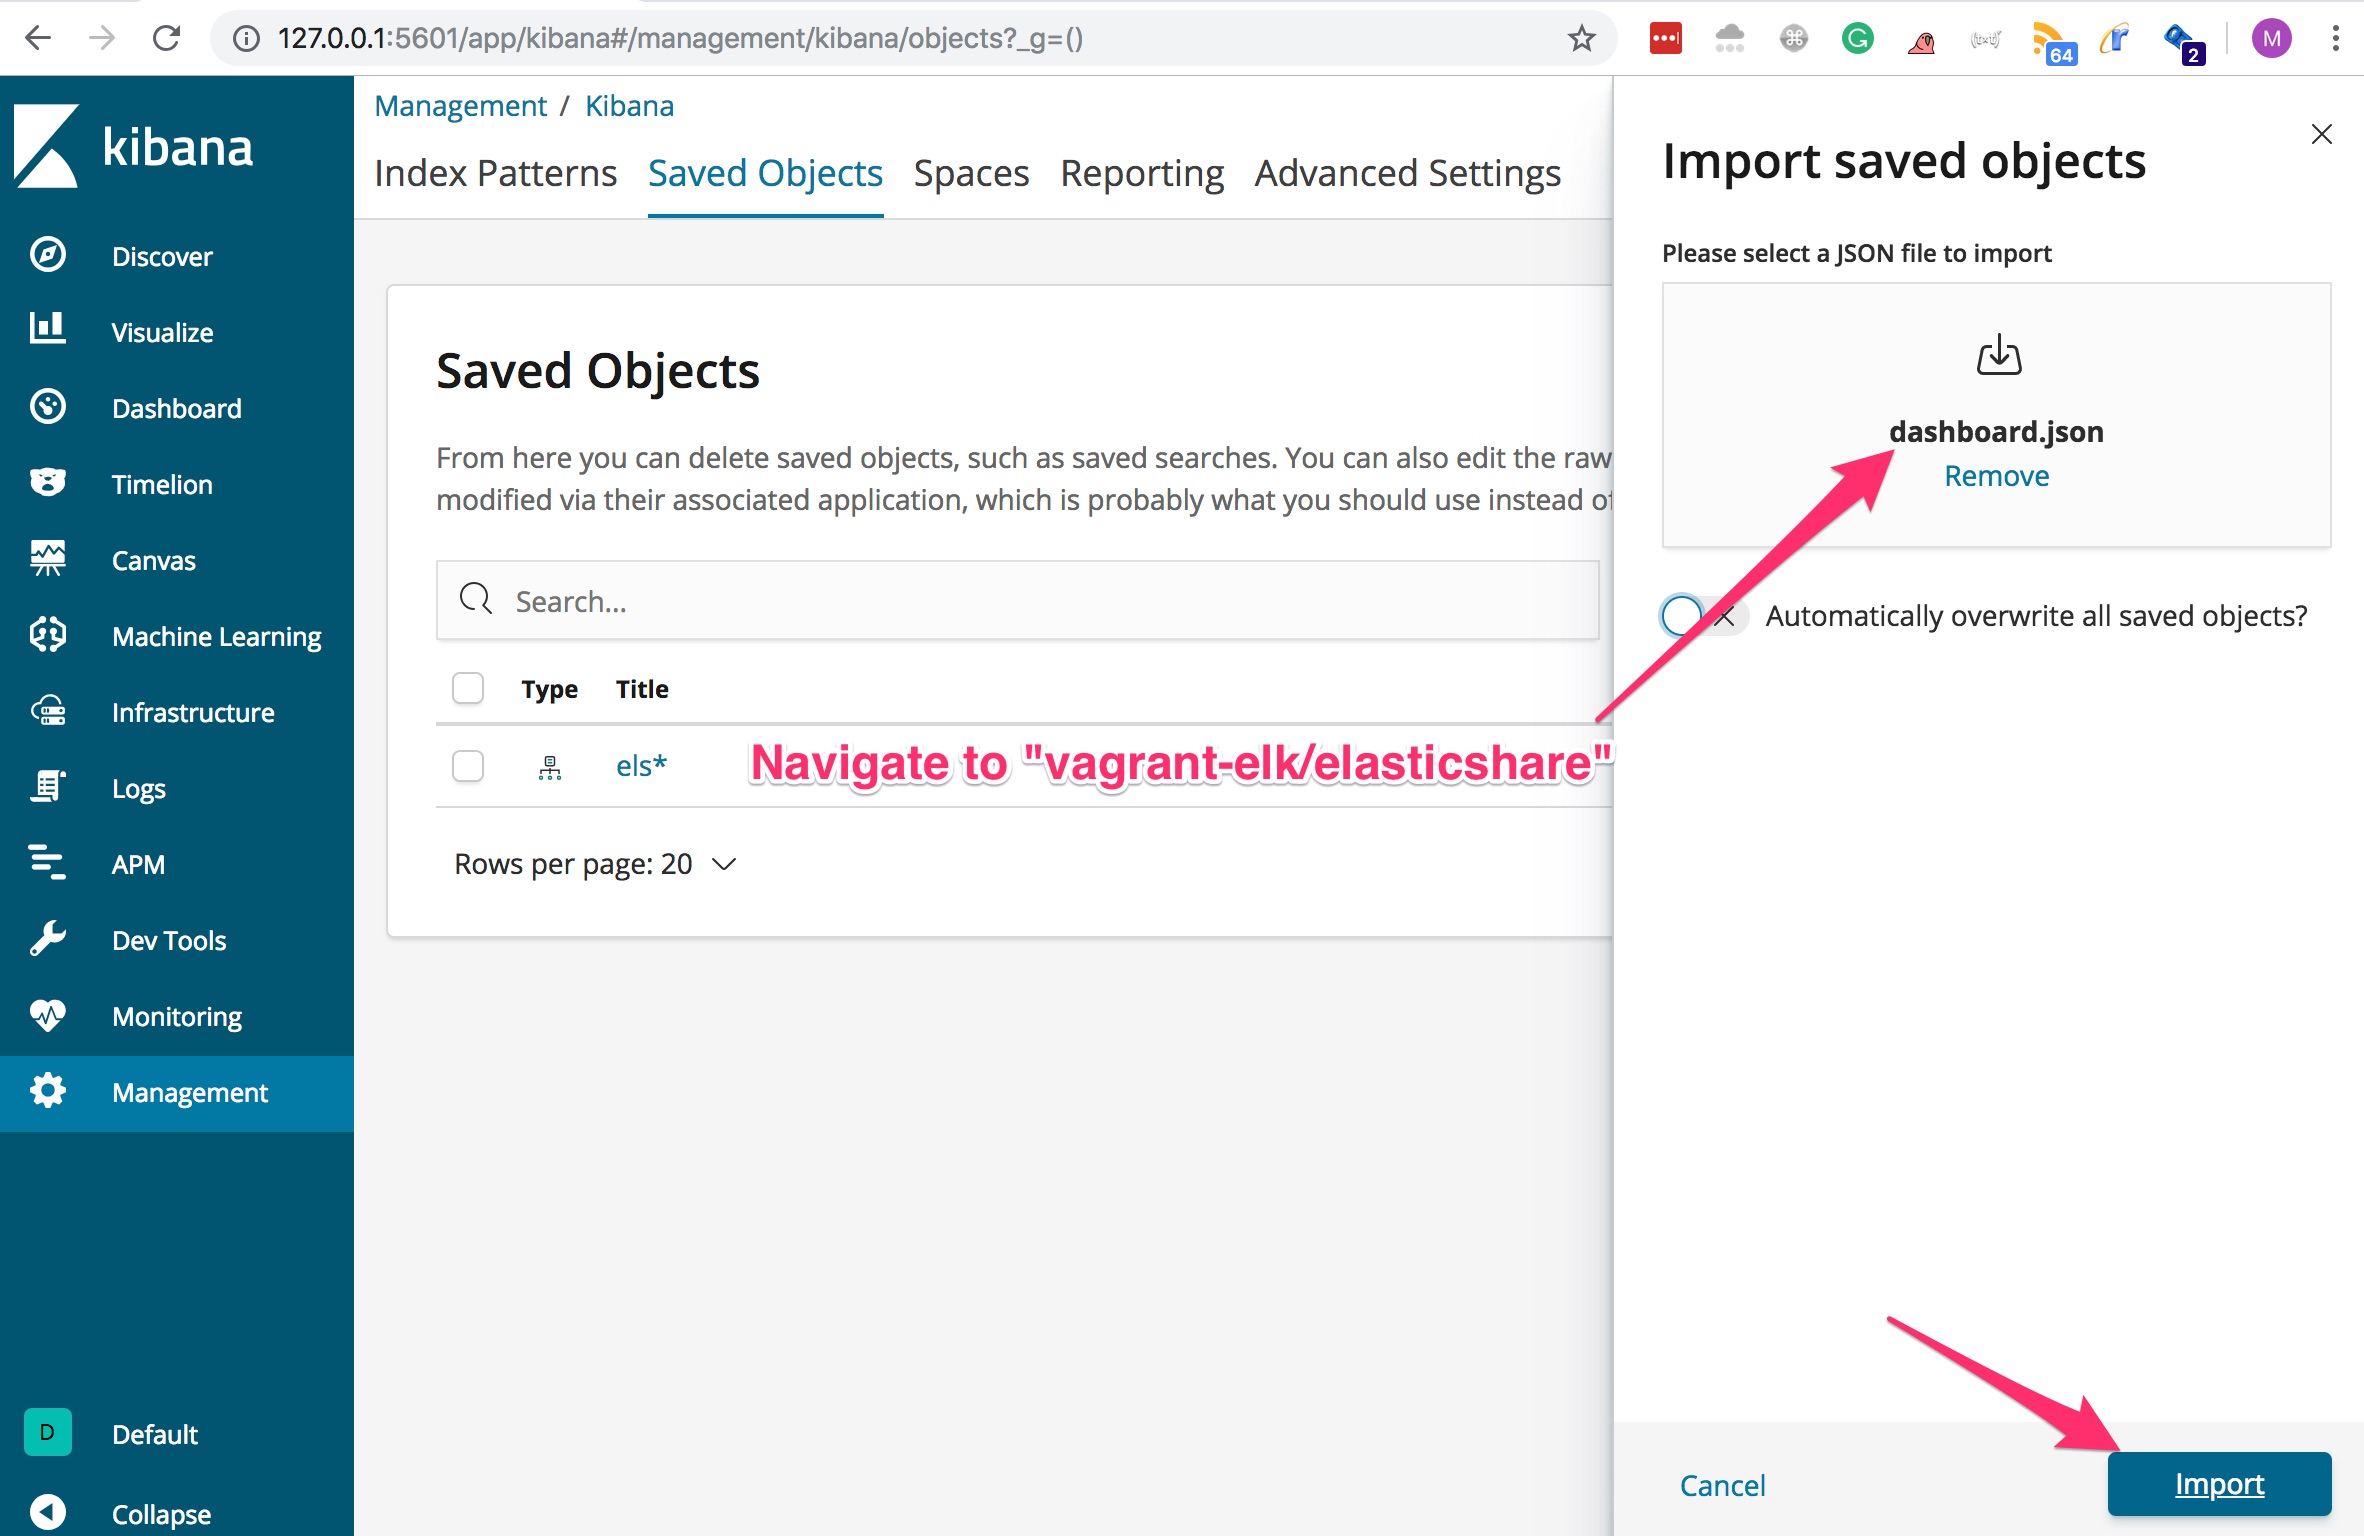
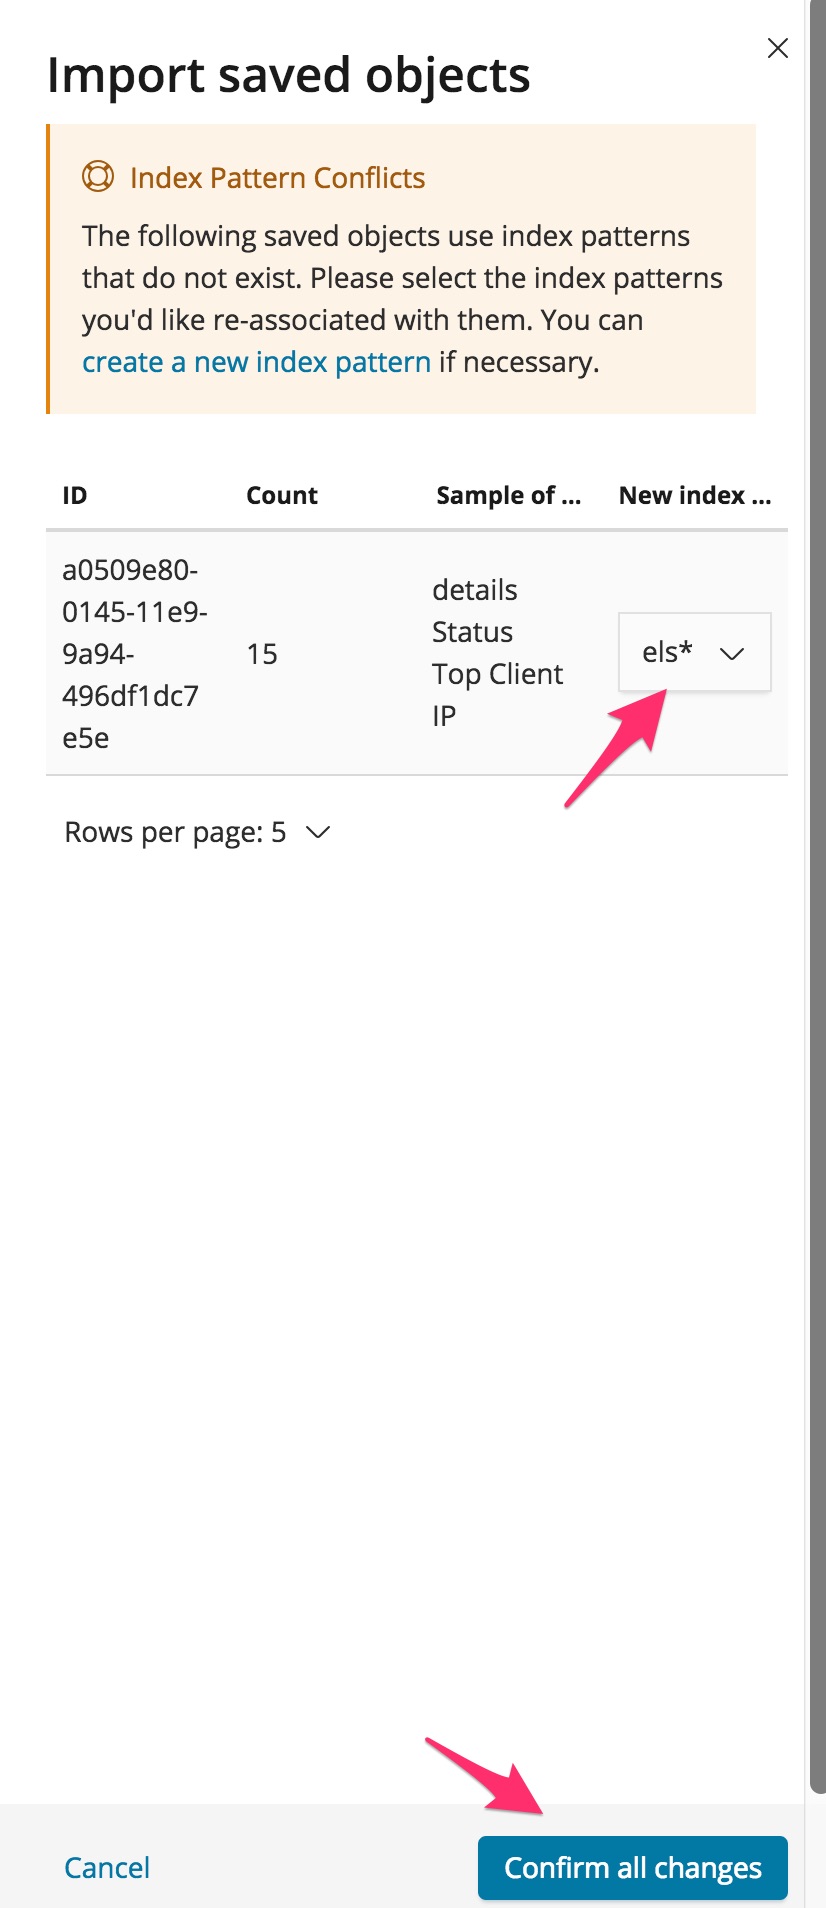
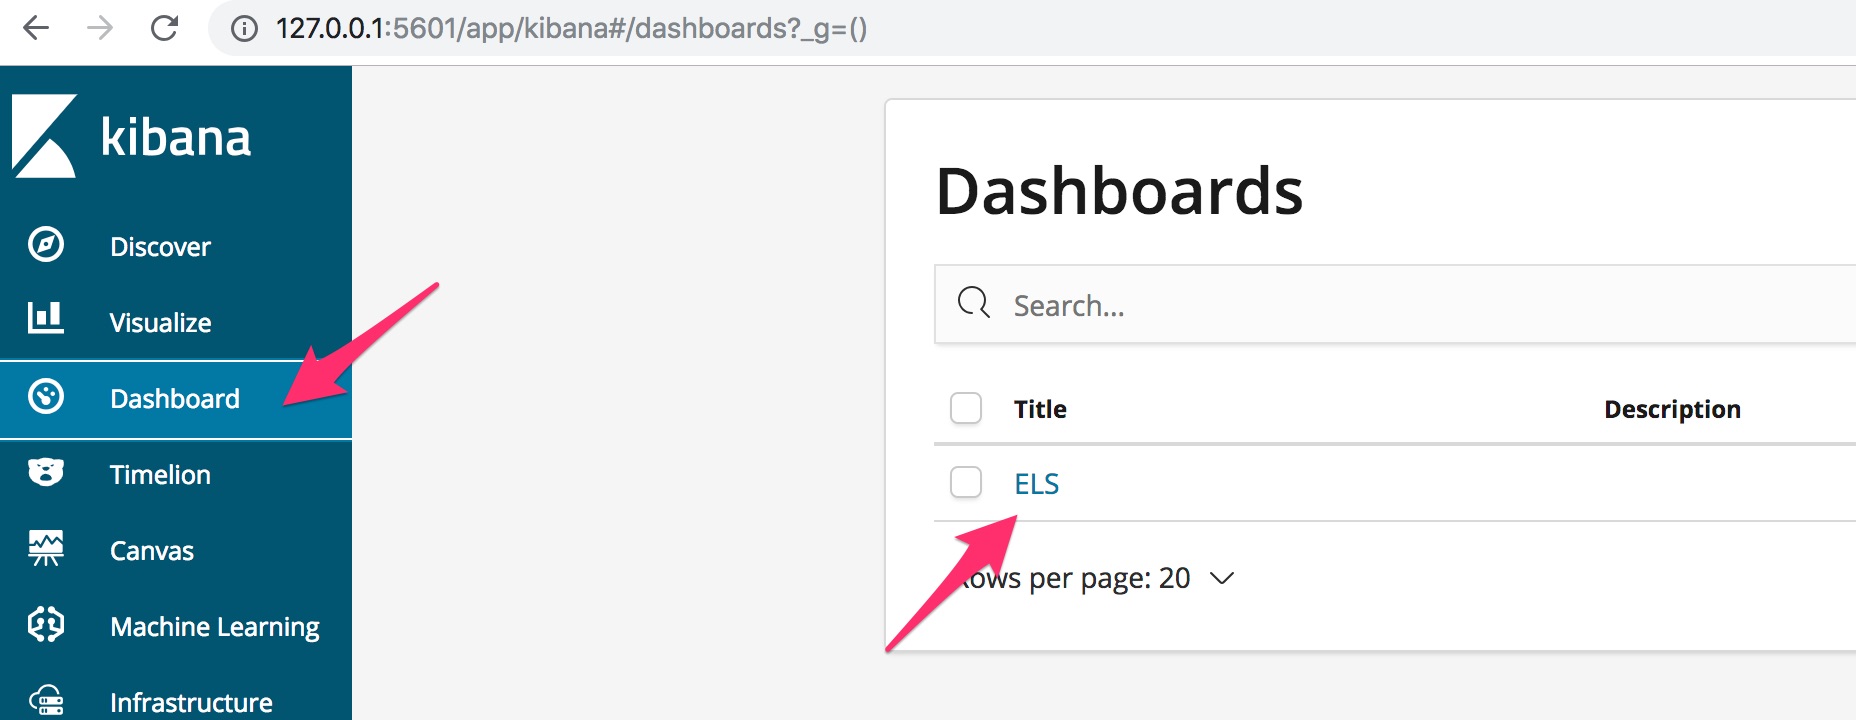
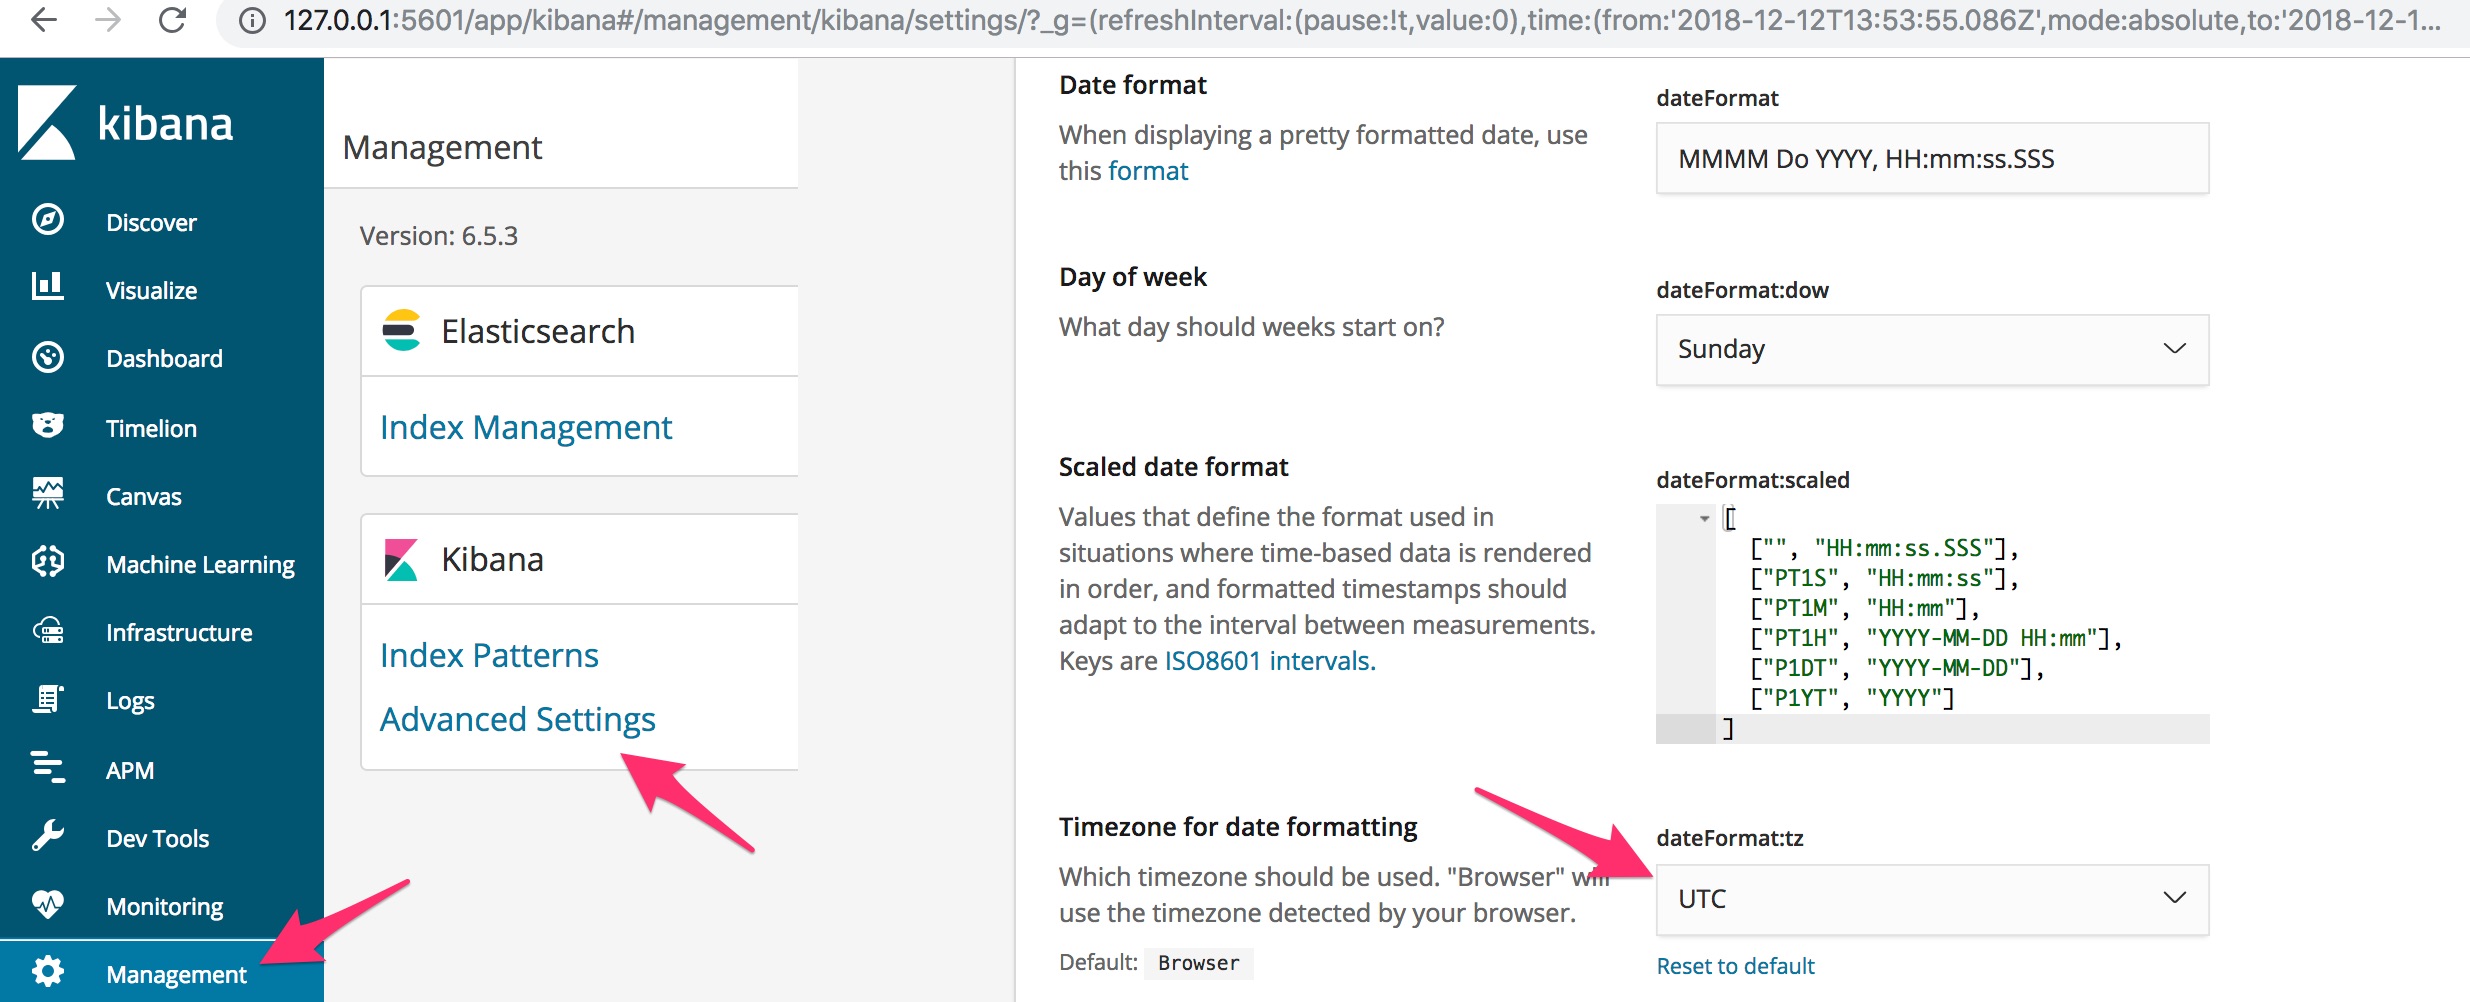
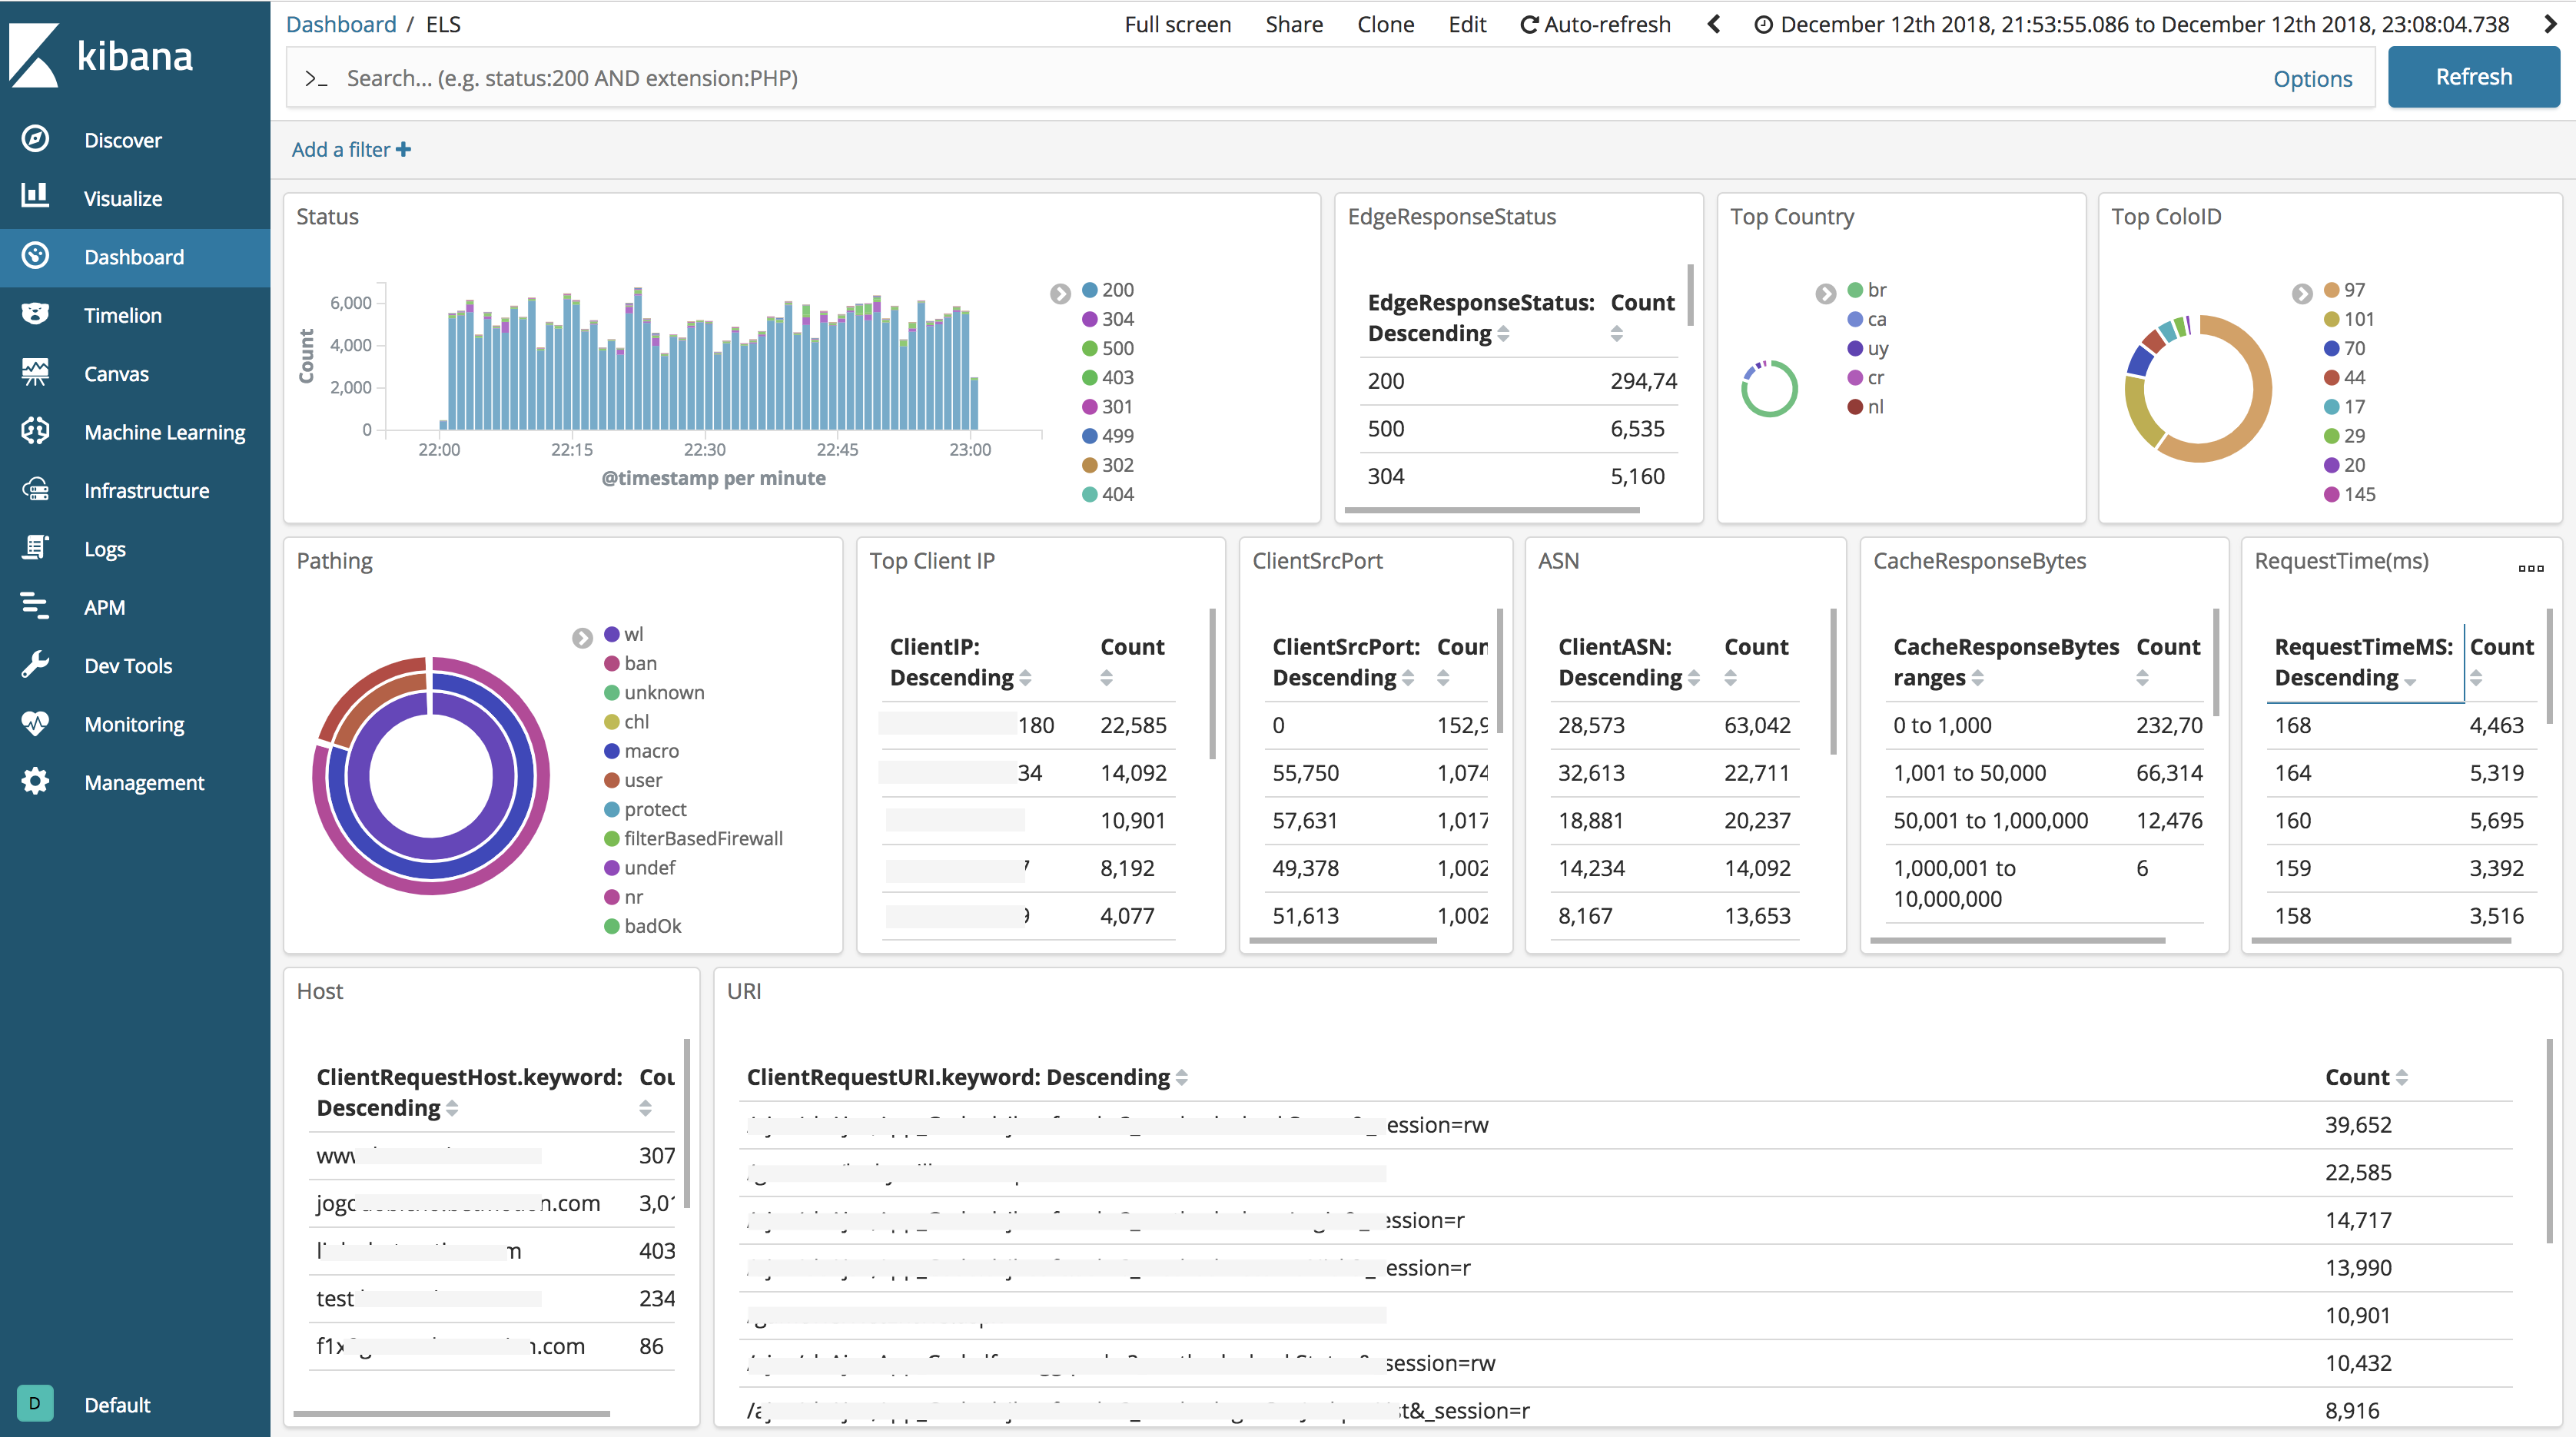
Set up the Kibana dashboard
follow the instructions in the screenshots below.