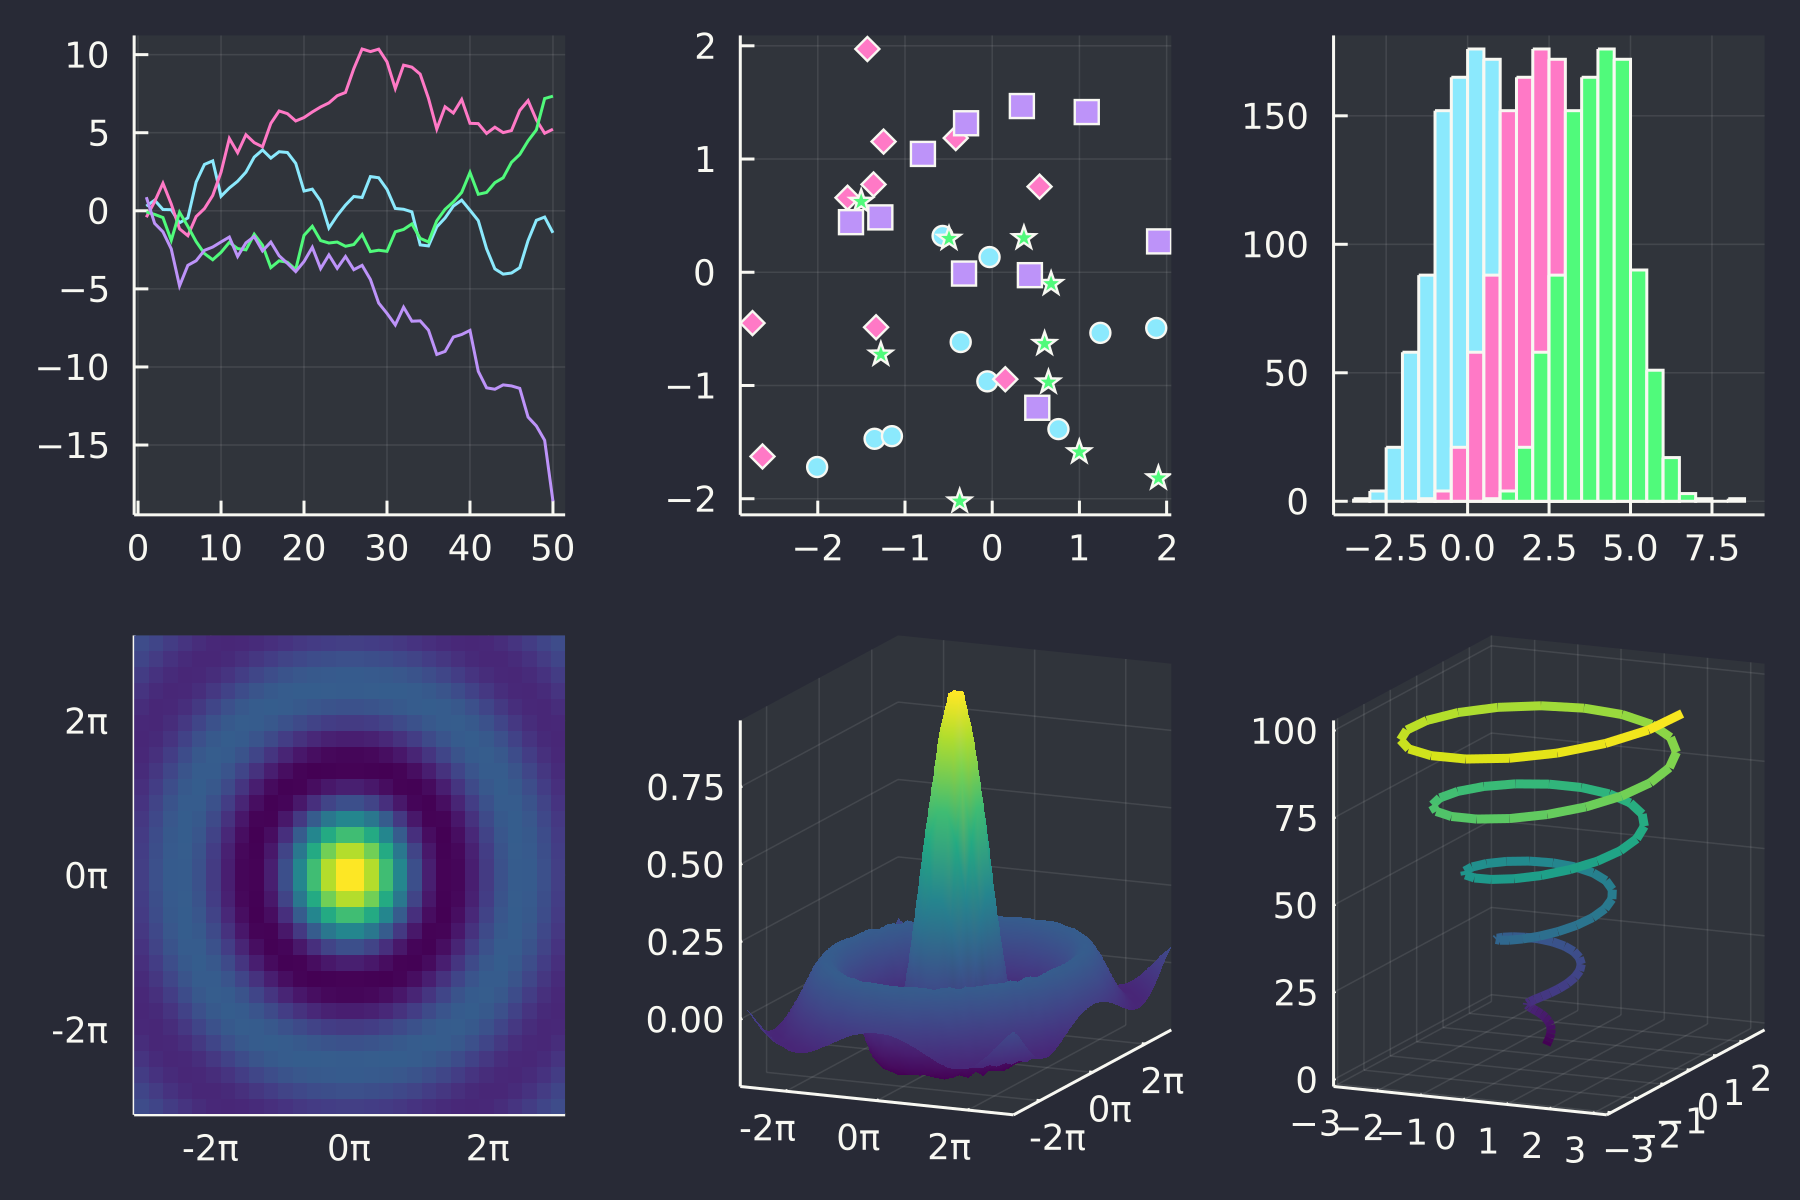
PlotThemes is a package to spice up the plots made with Plots.jl. To install:
Pkg.add("PlotThemes")Currently the following themes are available:
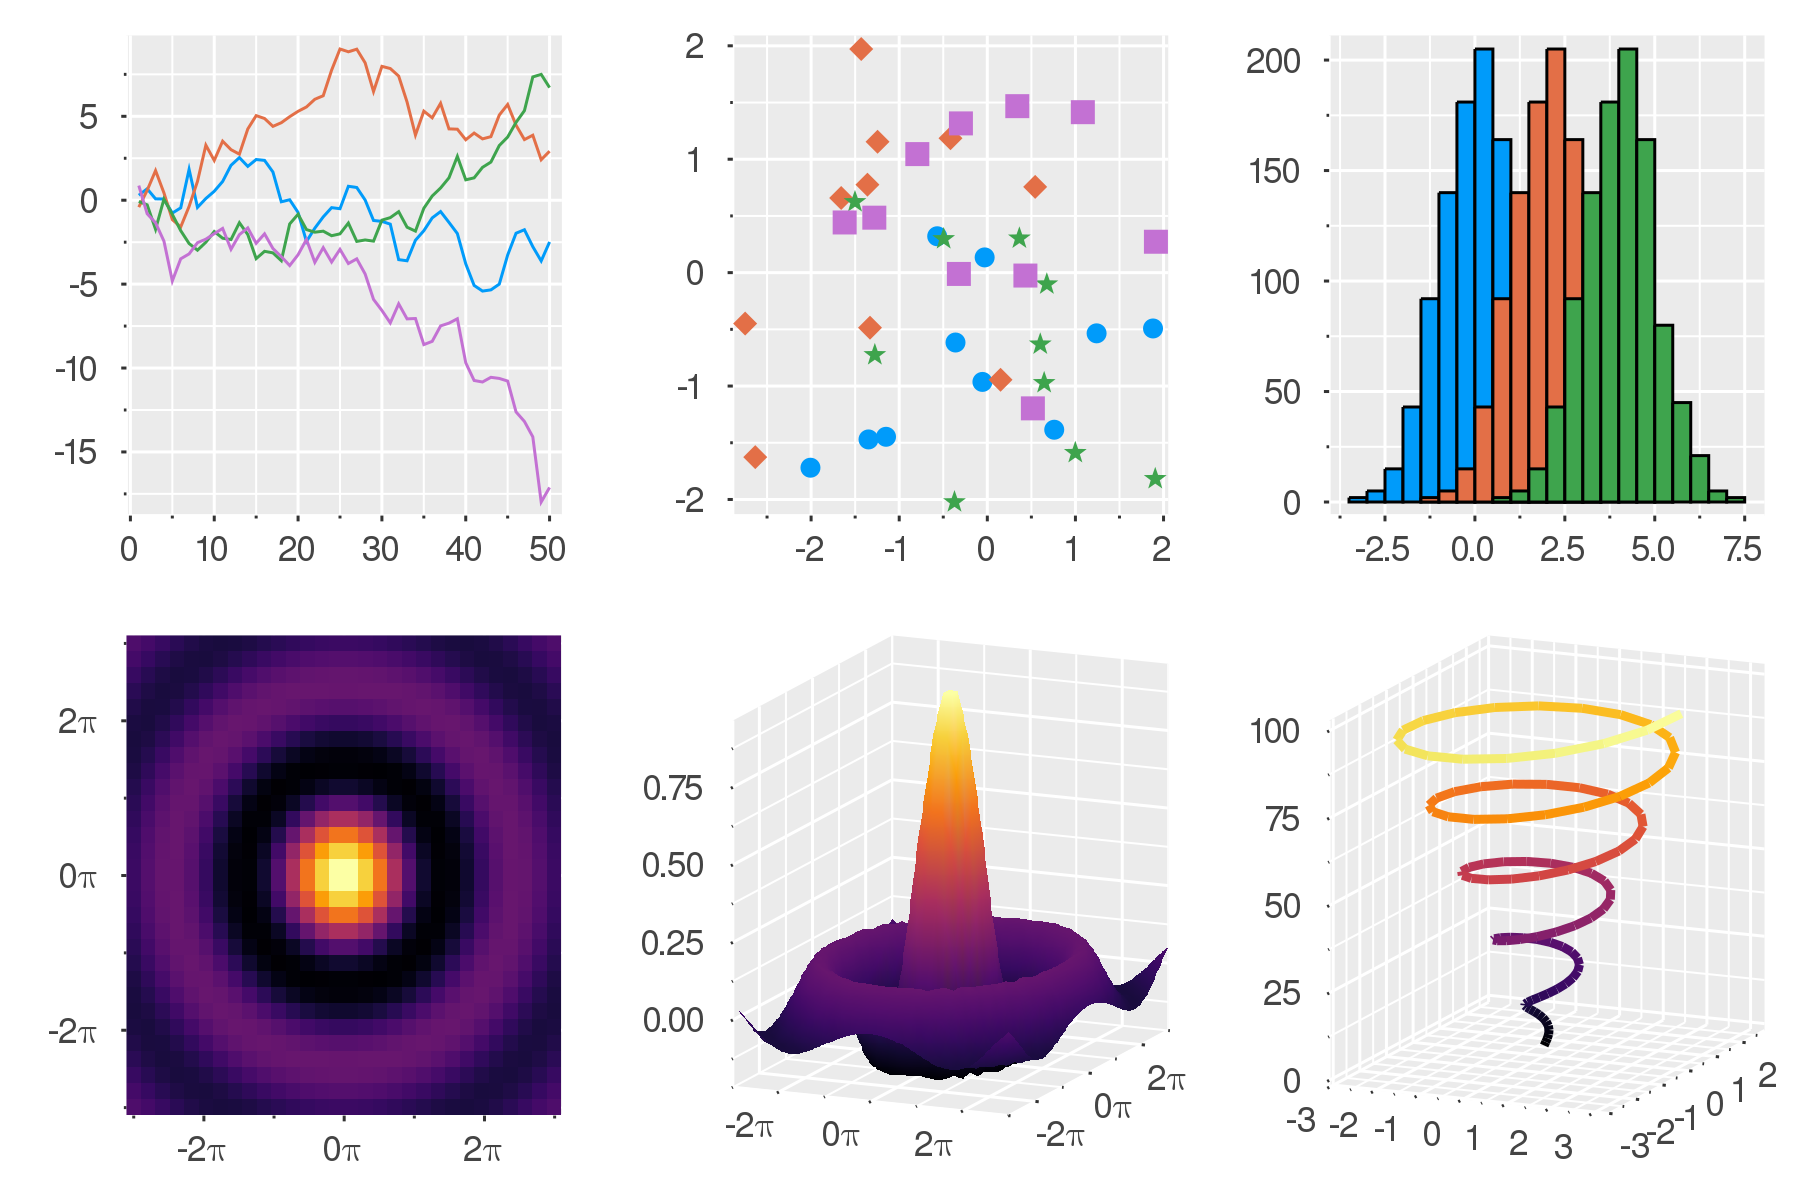
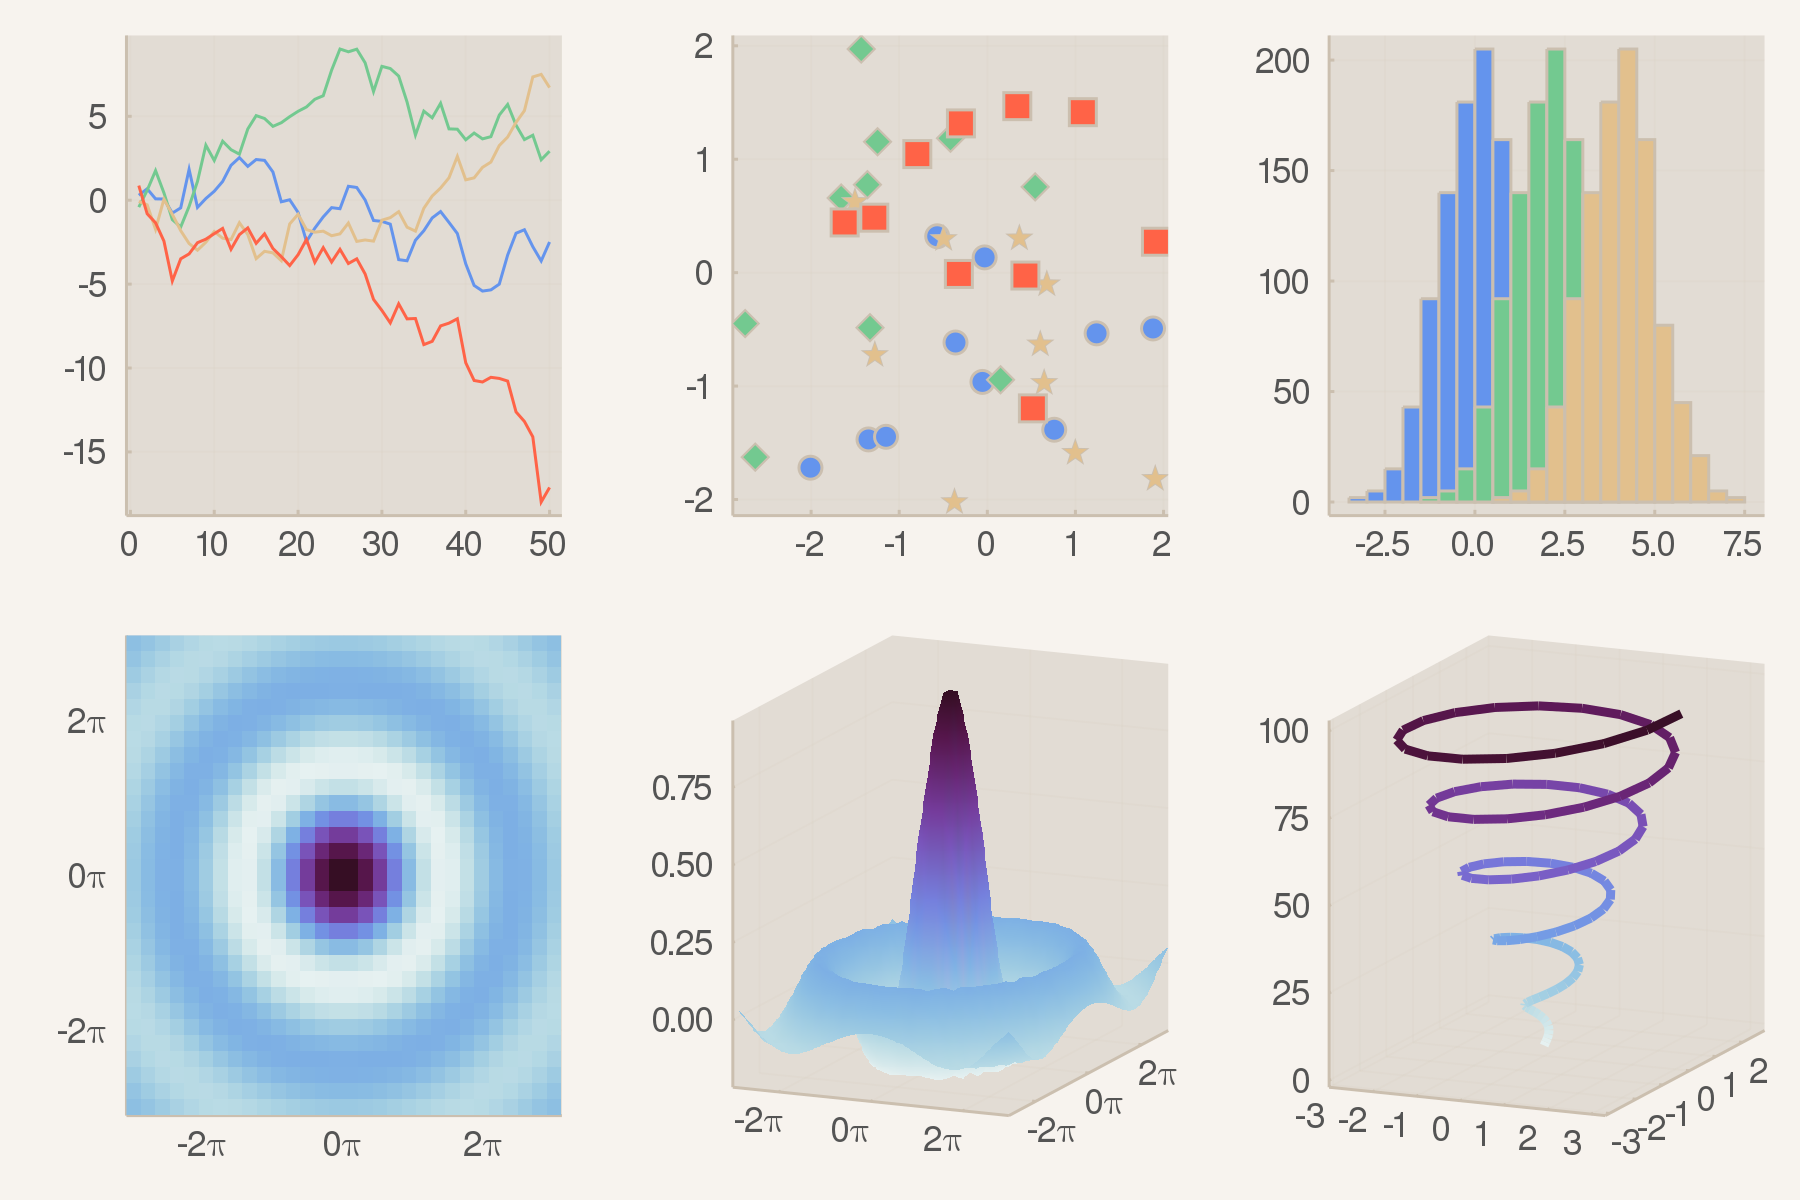
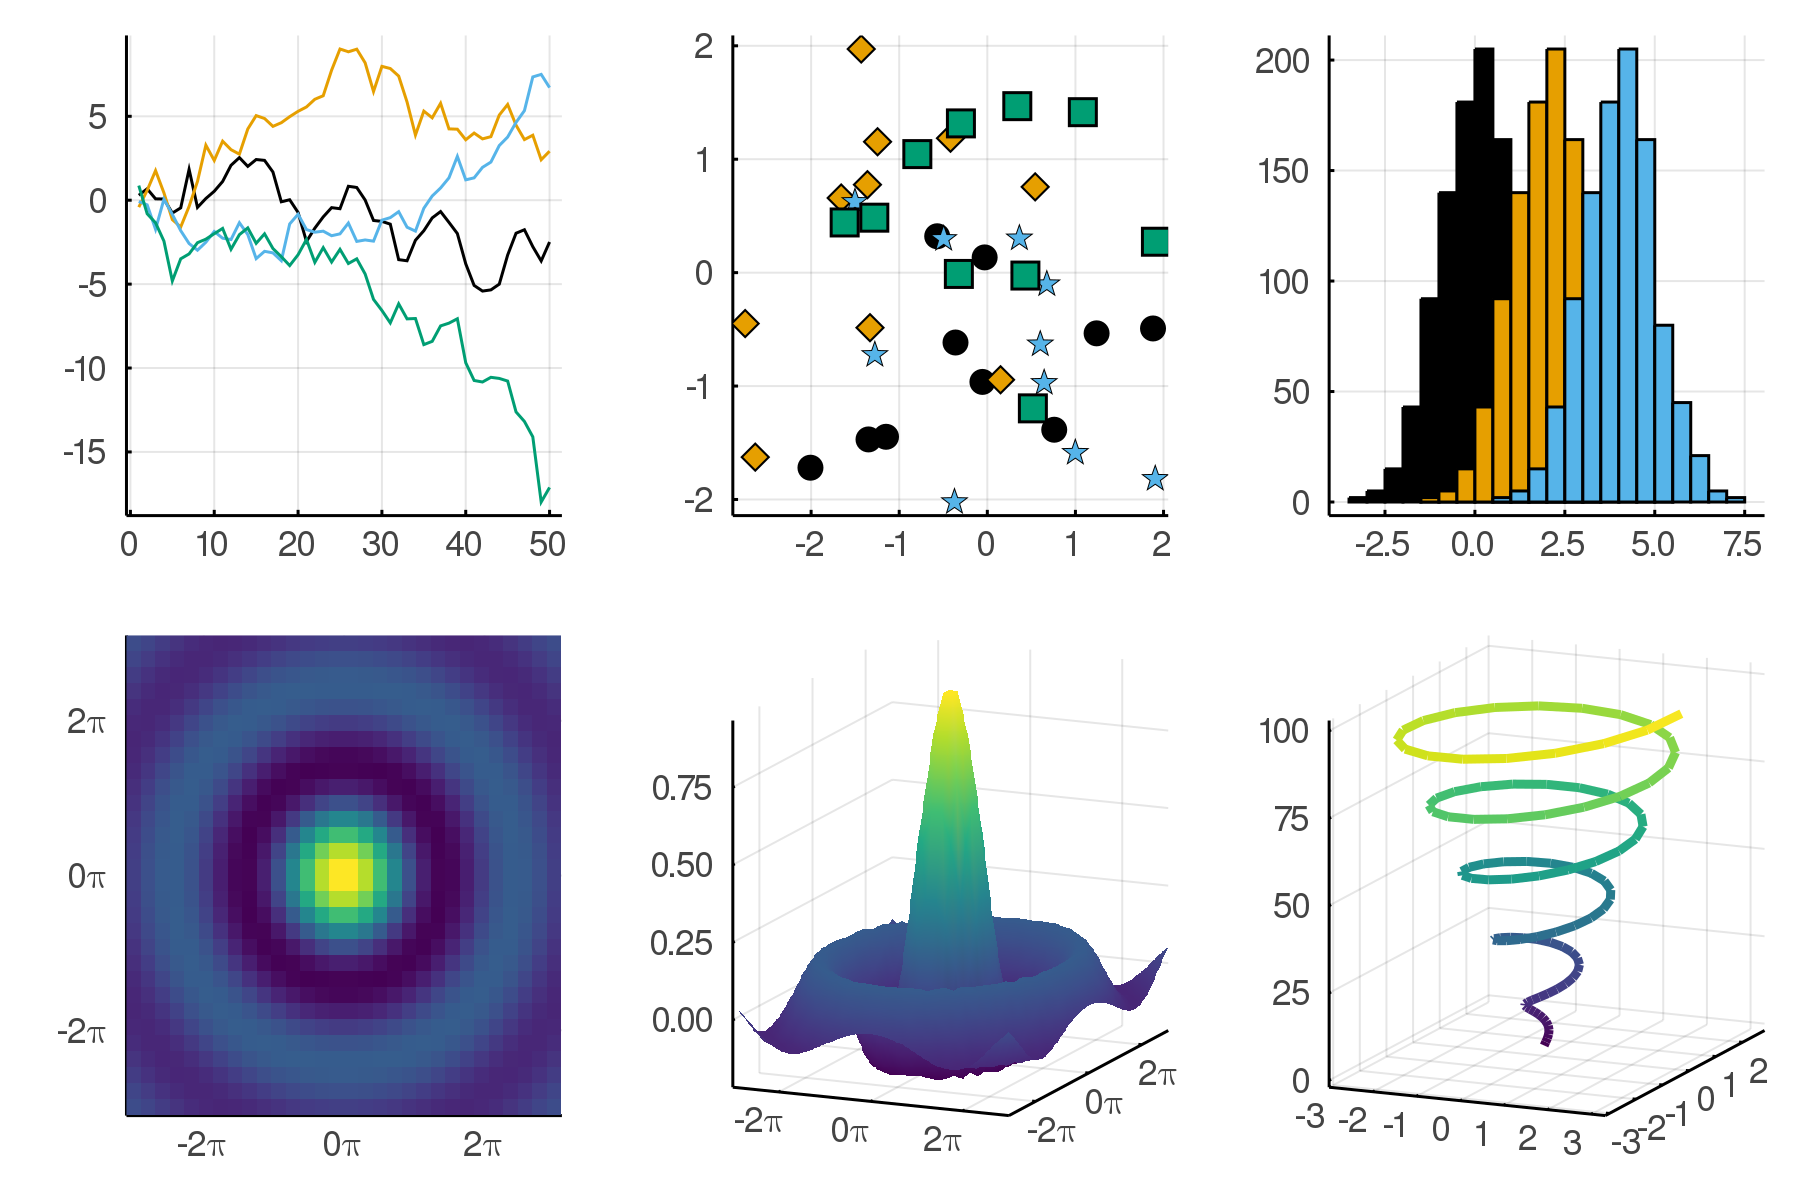
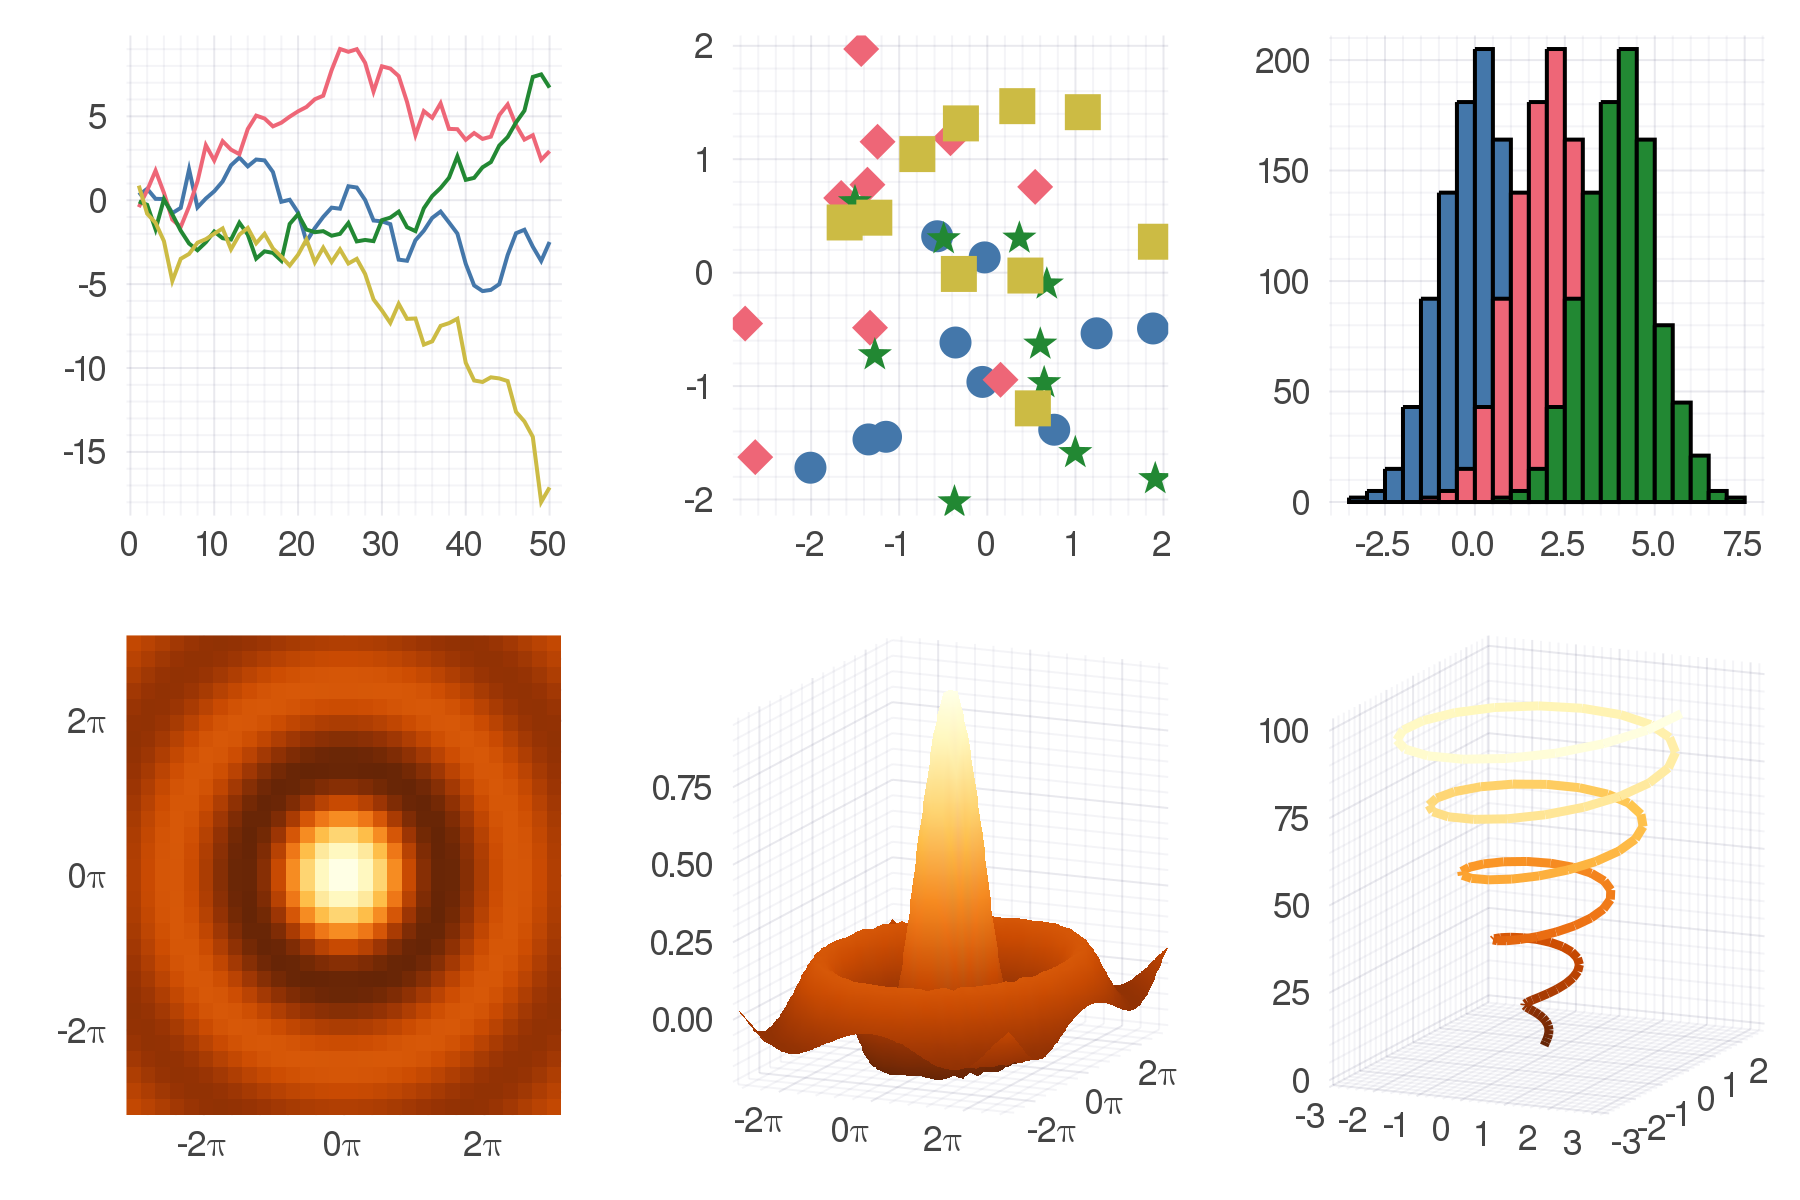
:default:dark:ggplot2:juno:lime:orange:sand:solarized:solarized_light:wong:wong2:boxed:gruvbox_dark:gruvbox_light:bright:vibrant:mute:dao:dracula:rose_pine:rose_pine_dawn
When using Plots, a theme can be set using the theme function:
using Plots
theme(thm::Symbol; kwargs...)
theme accepts any Plots attribute as keyword argument and sets its value as default for subsequent plots.
Themes can be previewed using Plots.showtheme(thm::Symbol):
A theme specifies default values for different Plots attributes.
At the moment these are typically colors, palettes and colorgradients, but any Plots attribute can be controlled by a theme in general.
PRs for new themes very welcome! Adding a new theme (e.g. mytheme) is as easy as adding a new file (mytheme.jl) that contains at least the following line:
_themes[:mytheme] = PlotTheme(; kwargs...)The keyword arguments can be any collection of Plots attributes plus a colorgradient keyword argument.
For adding the showtheme figure to README.md, use
Plots.showtheme(:your_theme)
plot!(dpi=400)
savefig("your_theme.png")
The image can be uploaded to the README.md file by pulling it in with the file-editing web interface.


