-
Notifications
You must be signed in to change notification settings - Fork 54
Experiment Monitoring
Scott Sievert edited this page Feb 17, 2017
·
1 revision
The dashboards provide live monitoring tools. It provides
- experiment results (i.e., rankings, embeddings). These are shown for different algorithms
- algorithm timing.
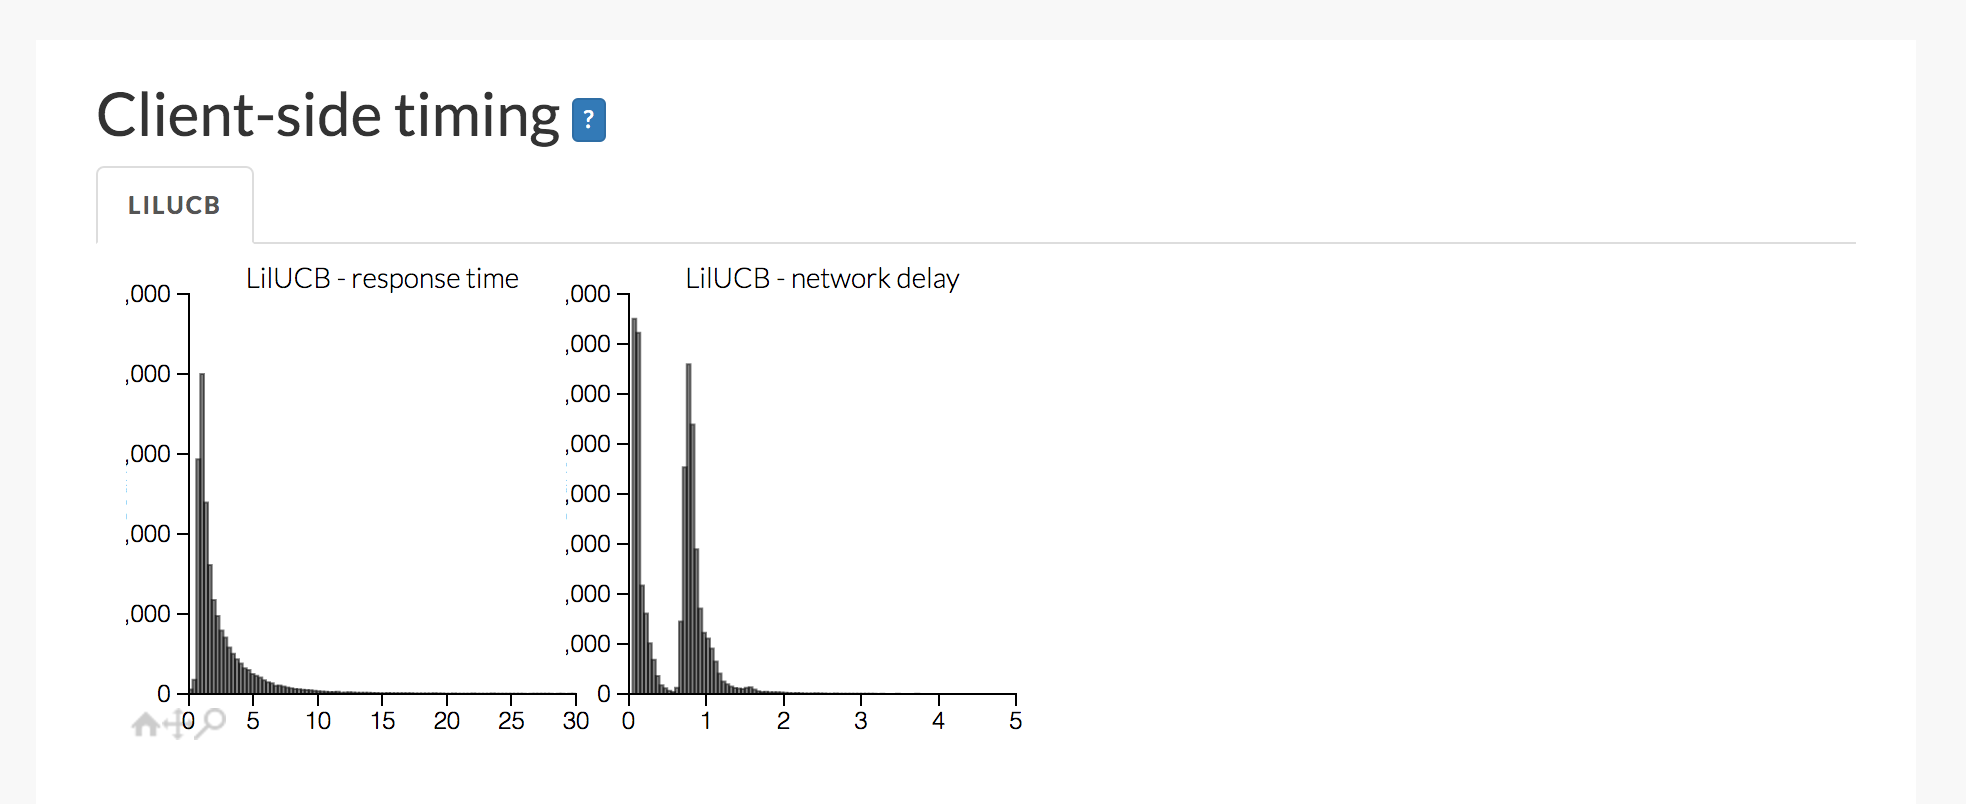
- User network delay and response time
- participant responses (as JSON and CSV)
- access to backend exceptions (with notification!)
- basic experiment info (date launched, number of users, number of responses)
- histogram of user responses
The basic experiment info and histogram of user responses:

The algorithm timings. Note that the "Individual algorithm timing breakdown" is per-algorithm but only one algorithm is present in this experiment and "Algorithm timing comparison" the timing of all algorithms for all relevant functions.

Per-algorithm, this is how long the network took (total time for NEXT to respond) and the user's response time:

These are the rankings of the algorithm. This can (and should) be customized for your app. This can show images (i.e., embedding) or a list (or text or images) and/or any valid HTML. Complete description on development can be found in Dashboard.
