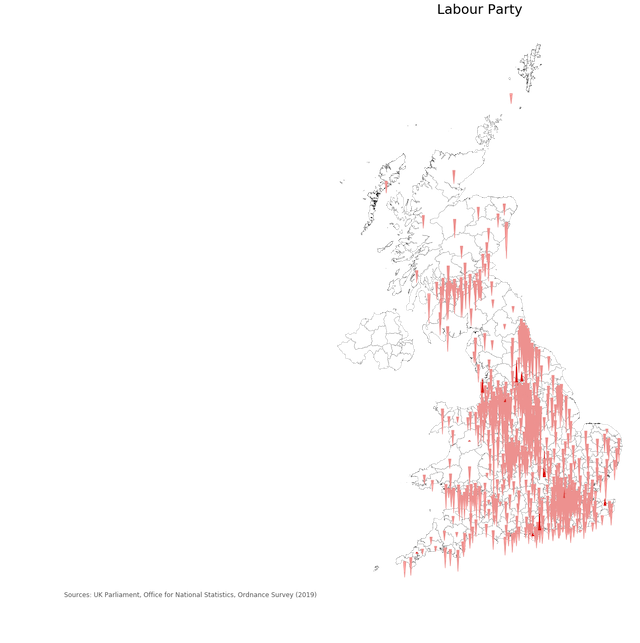
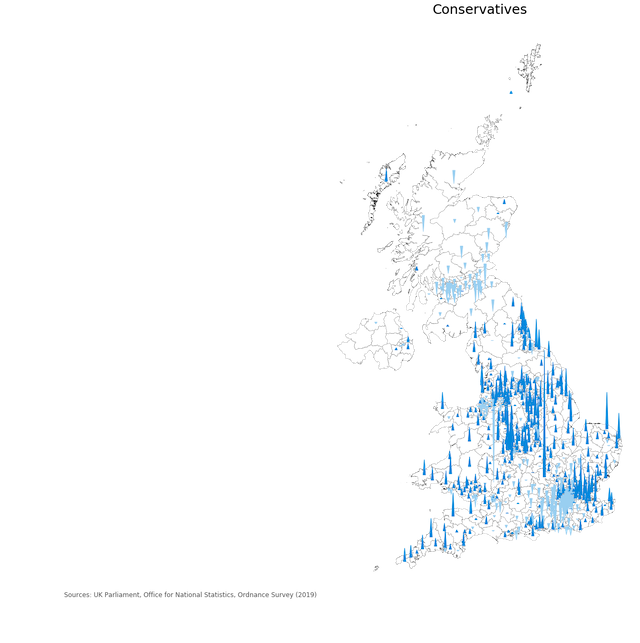
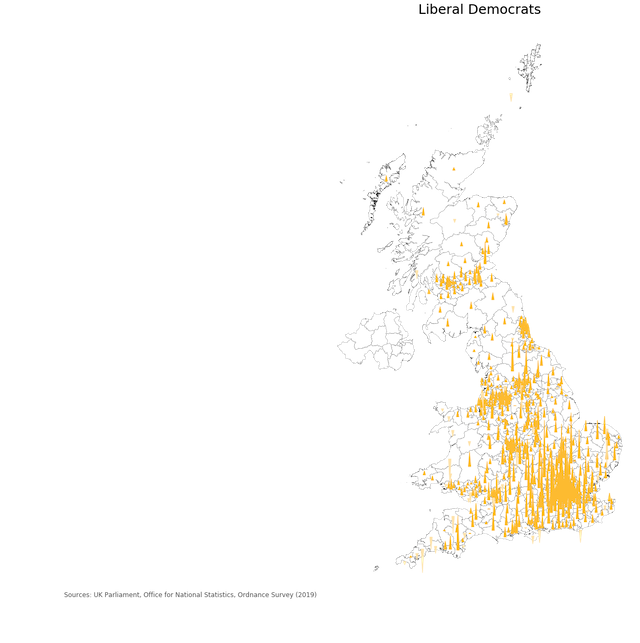
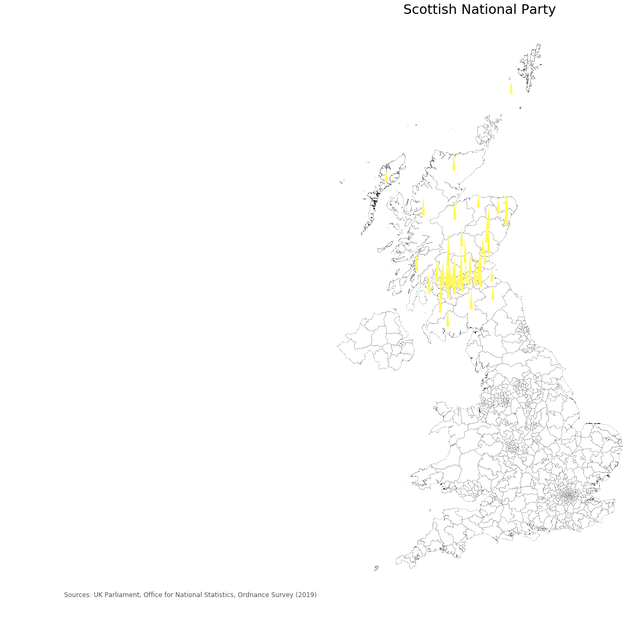
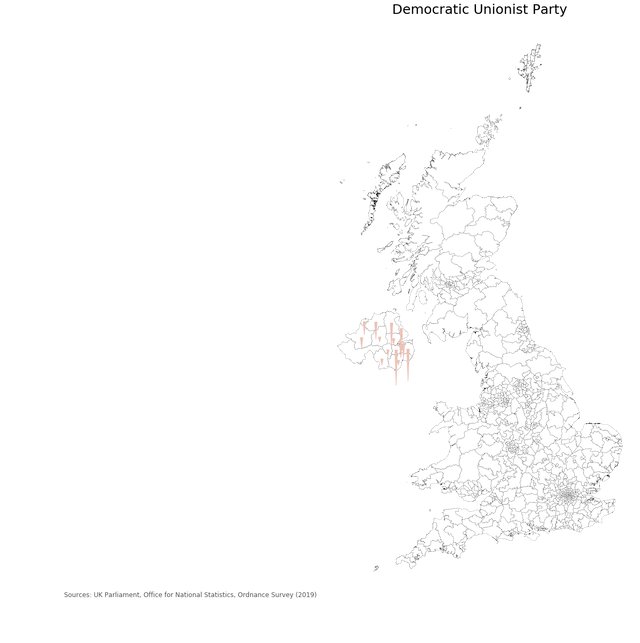
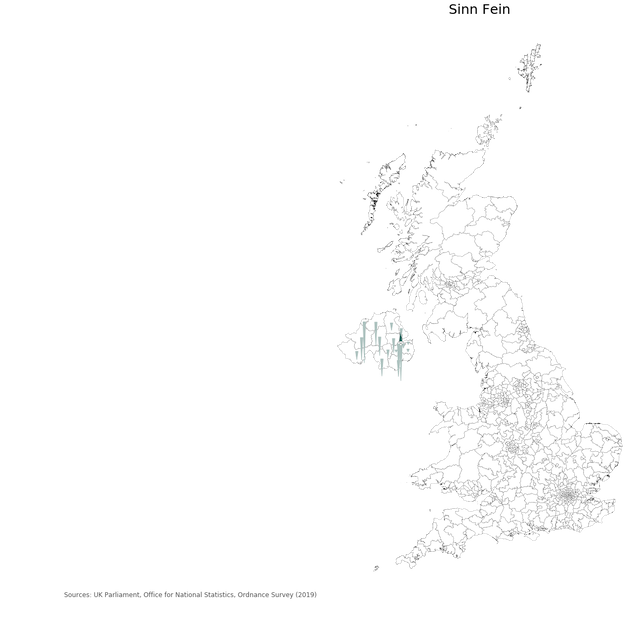
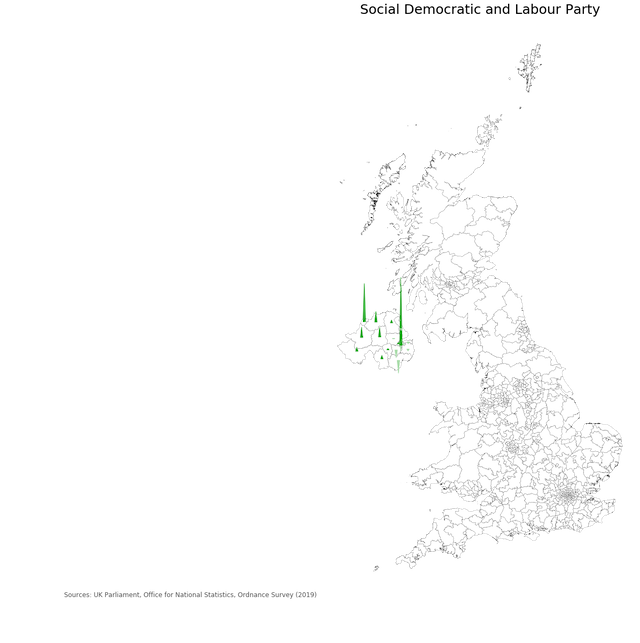
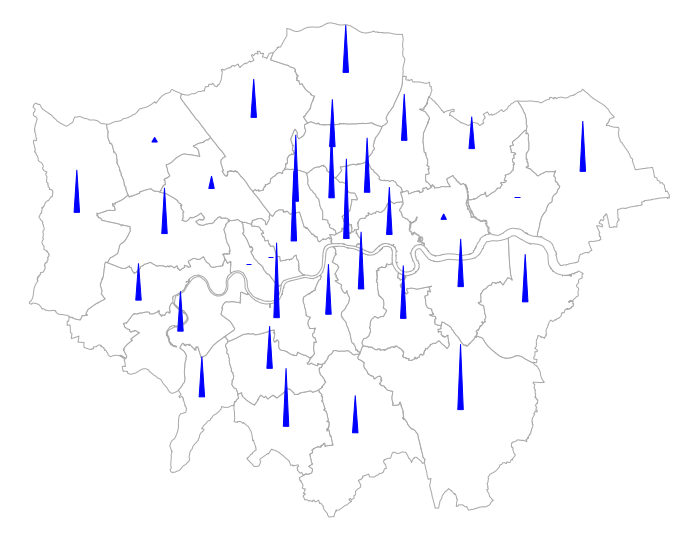
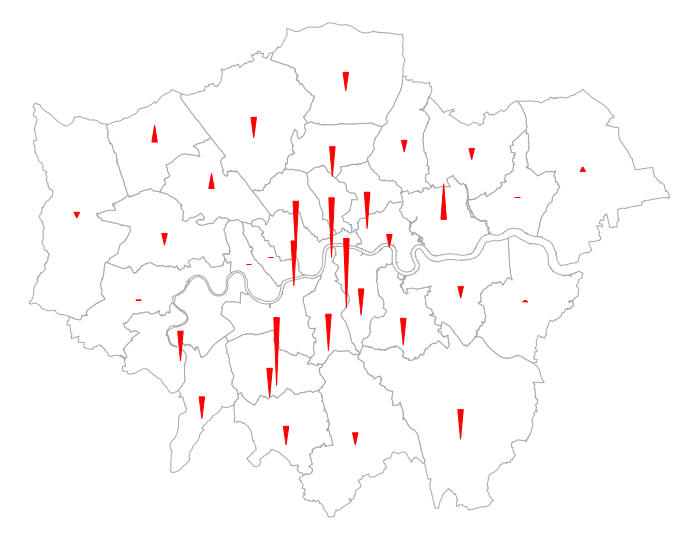
Replicating in Python the electoral maps made by the Berliner Morgenpost.
The Berliner Morgenpost made these absolutely brilliant electoral maps that show, for each major party, the variation of votes in each constituency based on two elections. They released the R code at [https://interaktiv.morgenpost.de/analyse-bundestagswahl-2017/data/btw17_analysis.html].
Thing is, I'm terrible at R. So I've created a jupyter notebook with a very simple workflow to create similar maps in Python. The jupyet guides you through all the steps required.
UPDATED Now with a full walk-through with the maps for the general election 2017-2019.
Contains National Statistics data © Crown copyright and database right [2015] Contains Ordnance Survey data © Crown copyright and database right [2015]
