This Splunk app provides custom source types and views into the status of Puppet installations that are configured to send reports, facts and metrics with the splunk_hec, puppet_metrics_collector and pe_status_check Puppet modules.
You can take action on this data by connecting a Splunk installation to the PE Orchestration service via the Puppet Alert Orchestrator add-on for Splunk.
Once the application has been installed follow the steps below to configure the Puppet Report Viewer app for Splunk:
Create an Splunk HEC token for the app:
- Select Puppet Report Viewer from the App dropdown in the Splunk console.
- Navigate to
Settings>Data Input. - Add a new
HTTP Event Collectortoken with a name of your choice. - Ensure
indexer acknowledgementis not enabled. - Click Next and set the source type to Automatic.
- Add the
mainindex - Set the Default Index to
main. - Click Review and then Submit.
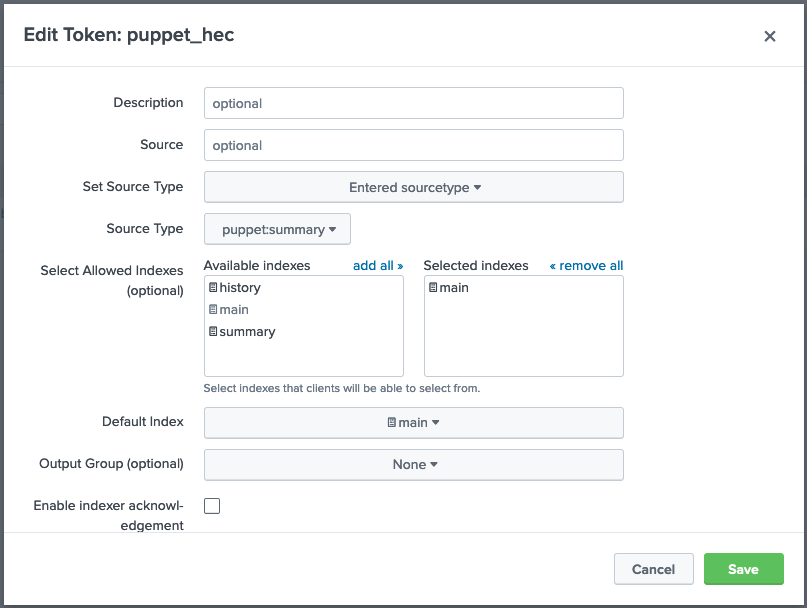
- When complete the HEC token should look something like this:
After configuring splunk_hec, puppet_metrics_collector, and pe_status_check the Overview tab will start showing data from Puppet reports, while the PE Metrics tab will start displaying graphs related to a number of useful Puppet metrics and results of status checks.
This app includes the following custom source types:
-
Data from puppetlabs-splunk_hec module:
puppet:factspuppet:summary
-
Data from puppetlabs-puppet_metrics_collector module:
puppet:metrics
-
Data from puppetlabs-pe_event_forwarding module:
puppet:activities_classifierpuppet:activities_code_managerpuppet:activities_consolepuppet:activities_rbacpuppet:activitypuppet:events_summarypuppet:jobs
-
Data from Puppet Alert Orchestrator add-on for Splunk:
puppet:actionpuppet:boltpuppet:detailed
-
Data from Puppet infrastructure nodes via Splunk Forwarder:
puppet:service_logspuppet:access_logs
Note: Access and Service logs for the following Puppet services are currently supported.
- PE Console
- PE Orchestrator
- PuppetDB
- Puppet Server
All dashboard views support using custom indexes for storing event data. The searches assume each sourcetype can be stored in it's own index. There is one top level macro (puppet_index) which defaults to "".
As such, you can specify different HEC tokens for Summary Reports, Facts, and Metrics in splunk_hec. If you configure multiple HEC tokens to utilize different indexes, change the index value in the dashboards to reflect this.
Create five indexes named puppet_data, puppet_summary_data, puppet_facts_data, puppet_metrics_data, and puppet_detailed_data.
Create five HEC tokens:
puppet_datawith sourcetype ofautomaticand the indexpuppet_data.puppet_summarywith sourcetype ofpuppet:summaryand the indexpuppet_summary_data.puppet_factswith sourcetype ofpuppet:factsand the index ofpuppet_facts_data.puppet_metricswith sourcetype ofpuppet:metricsand the index ofpuppet_metrics_data.puppet_detailedwith sourcetype ofpuppet:detailedand the index ofpuppet_detailed_data.
Configure the splunk_hec module with the following token parameters:
splunk_hec::tokenwith thepuppet_datatoken value.splunk_hec::token_summarywith thepuppet_summarytoken value.splunk_hec::token_factswith thepuppet_factstoken value.splunk_hec::token_metricswith thepuppet_metricstoken value.
Update the search macros to use the new values:
- Open Advanced Search under
Settings>Knowledge. - Select
Search Macros. - Select
puppet_indexand change the definition toindex=puppet_data, click save. - Select
puppet_summary_indexand change the definition toindex=puppet_summary_data, click save. - Select
puppet_facts_indexand change the definition toindex=puppet_facts_data, click save. - Select
puppet_metrics_indexand change the definition toindex=puppet_metrics_data, click save. - Select
puppet_detailed_indexand change the definition toindex=puppet_detailed_data, click save.
Upon reloading the Overview tab in the Puppet Report Viewer app, and you should begin seeing data. Alternatively, perform the following search:
`puppet_all_index` sourcetype=puppet:*
Top API Calls
`puppet_logs_index` sourcetype=puppet:access_logs source=*puppetserver-access.log
| rename request as Endpoint
| chart avg(elapsed_time) as "Time (ms)" by Endpoint
| sort - "Time (ms)"
Longest Compile Time
`puppet_logs_index` sourcetype=puppet:access_logs source=*puppetserver-access.log method=POST request=/puppet/v3/catalog*
| chart max(elapsed_time) as "Time (ms)" by client
| sort - "Time (ms)"
Longest Query Time
`puppet_logs_index` sourcetype=puppet:access_logs source=*puppetdb-access.log request=/pdb/query/*
| chart max(elapsed_time) as "Time (ms)" by client
| sort - "Time (ms)"
Sync Issues
`puppet_logs_index` sourcetype=puppet:service_logs service=sync log_level=WARN OR ERROR
| chart values(message) as Message by log_level
If the Puppet Report Viewer does not appear to show any data after you have followed the configuration steps for both this app and the splunk_hec module; first check that data is being successfully sent to the Splunk server by following the troubleshooting and verification steps in the splunk_hec documentation.
If events in the puppet:detailed source type is not showing up in search, it means that the "Generate a Detailed Report" Alert is not configured properly with the Puppet Alert Orchestrator add-on. If this Alert is enabled, and the aforementioned add-on is configured, you can view the logs with the following Splunk search:
index=_internal sourcetype=splunkd component=sendmodalert (action="puppet_run_task_investigate" OR action="puppet_run_task" OR action="puppet_run_task_act" OR action="puppet_generate_detailed_report")
There is also a view into the Alert Actions logs under the Actions tab which will show these searches as well.
If there are no error messages, verify that the configured HEC works can be used to submit a report manually:
$ curl -k -H "Authorization: Splunk <yourHECtoken>" https://localhost:8088/services/collector/event -d '{"sourcetype": "puppet:detailed", "event": "exampletest"}'
The endpoint will respond with either a success or an error message. Follow steps in the HTTP Event Collector documentation to resolve issues with the HEC endpoint.
If there are other error messages in the logs related to PE RBAC tokens from the Puppet side, run the following command to query the PuppetDB API:
curl -k 'https://<your.puppetdb.server>:8081/pdb/query/v4/nodes' -H "X-Authentication: <token contents>"


