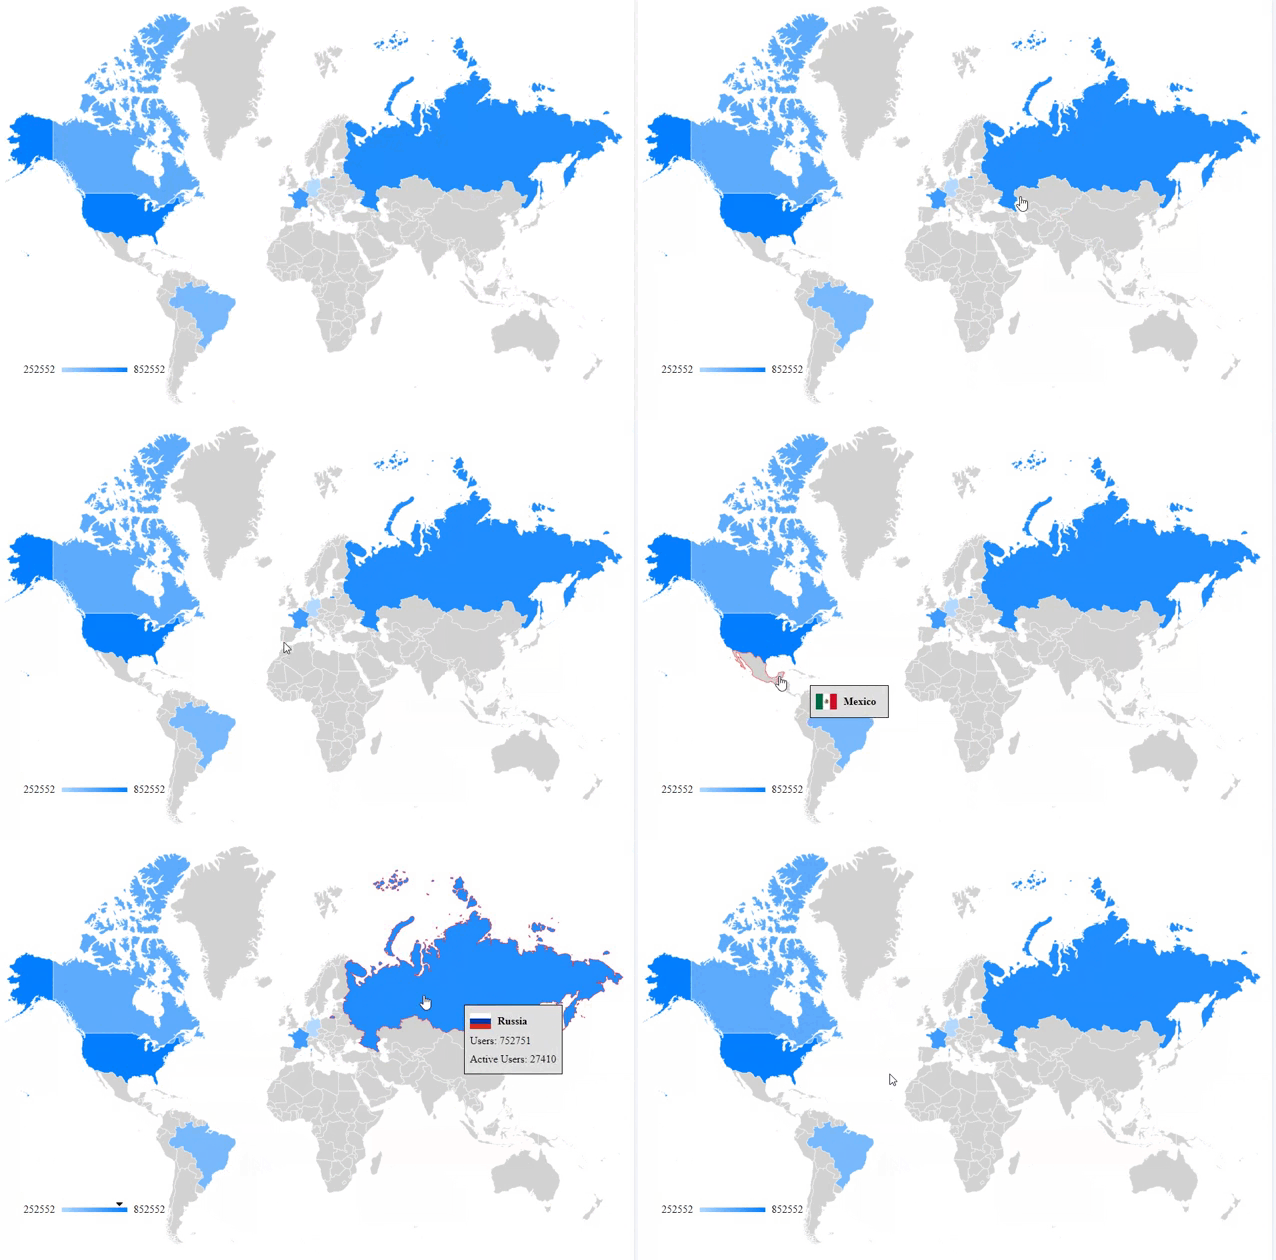
React Component for Geo Chart
styleprop to root- Country flags added
- customize stroke color for regions through the prop
strokeColor - customize tooltip background color through the prop
tooltipBackgroundColor
- يدعم اللغة العربية بشكل كامل
- Support RTL
- Localization Support
npm i regeo-map-chartimport React from 'react';
import { ReGeoMapChart } from 'regeo-map-chart';
const data = [
['Region', 'Users', 'Active Users'],
['de', 252552, 25000],
['us', 852552, 162306],
['br', 452552, 52794],
['ca', 544445, 27229],
['fr', 652552, 277416],
['ru', 752751, 27410],
];
function App() {
return (
<div>
<ReGeoMapChart data={data} width={350} />
</div>
);
}
export default App;import React from 'react';
import { ReGeoMapChart } from 'regeo-map-chart';
const data = [
['Region', 'Users', 'Active Users'],
['de', 252552, 25000],
['us', 852552, 162306],
['br', 452552, 52794],
['ca', 544445, 27229],
['fr', 652552, 277416],
['ru', 752751, 27410],
];
function ExampleGeoChart() {
return (
<ReGeoMapChart
data={data}
width={350}
datalessRegionColor="#FDE2E2"
datafulRegionColor="#1AC258"
backgroundColor="#fff"
hideMapLegend={true}
strokeColor="#737373"
tooltipBackgroundColor="#082032"
style={{ maxWidth: 500 }} // the styled applied to the div that wraps the svg
/>
);
}
export default ExampleGeoChart;By default Countries Name will be in English or Arabic depending on html tag property lang of the app or website. For adding other languages, you can pass an object or json file to the prop regionNamesText in this format:
{
    "regions": [
        {
            "id": "ad",
            "name": "Andorra"
        },
        {
            "id": "ae",
            "name": "United Arab Emirates"
        },
        {
            "id": "af",
            "name": "Afghanistan"
        },
        ...]
}
NOTE: Because order and structure matter, please make sure to make your localization json file based on this one: https://github.com/shadigaafar/regeo-map-chart/blob/main/src/docs/locales/world.en.json.
