-
Notifications
You must be signed in to change notification settings - Fork 55
TutorialBasics
Launch the program.

The main plot is for displaying data points.
Auxiliary plots can display various kinds of differential plots.
You can configure colors of everything, choose what to display at auxiliary plots or hide these plots, choose if you prefer do show data as a line or as points, choose the size of the points, and customize many other things. Finally, it is possible to save your configuration.

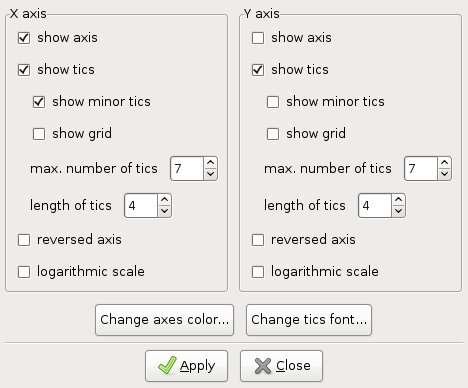
Two of the most useful settings are logarithmic Y axis and reversed X axis. The later is useful in XPS.
The first thing one usually does after launching the program is loading a dataset.

Sometimes the data needs to be preprocessed. Let's say you want to convert a Cu diffraction pattern to the Q scale. This can be done using so called ''data transformations''. Either type in the input line:
X = 4*pi * sin(x/2*pi/180) / 1.54051
or use the data editor.
Note: in more recent editions (ex, 1.3.1), the Data editor shown below has been split in 2 different tools: Table (in menu/Data) and Data transformation (in menu/Data/Edit Transformations... or toolbar icon for it).

You can define such a transformation once, add it to the Transformations menu and use it with a single mouse click.
Remember that it is the weighted sum of squared residuals that will be minimized and you should be aware what weights you use.
There are two kinds of data transformations, which have special support in the Fityk GUI. The first is activation and deactivation of points. Drag with the left/right mouse button to activate/deactivate, respectively.

The second is baseline removing.
