-
Notifications
You must be signed in to change notification settings - Fork 257
How to use Redpanda Console Manage AutoMQ
With the rapid development of big data technologies, Kafka has become a core component for real-time data processing in enterprises due to its high throughput and low latency as a distributed messaging system. However, managing and monitoring Kafka clusters is no easy task. Traditional command-line tools and scripts, while powerful, can be complex and unintuitive for developers and operations personnel. To address these challenges, Kafka Web UI emerged, offering users a more convenient and efficient way to manage Kafka clusters.
After more than a decade of development, Apache Kafka® has accumulated a rich ecosystem in the industry. As the successor to Apache Kafka®, AutoMQ is fully compatible with Kafka and can take full advantage of its ecosystem products. The enterprise edition of AutoMQ already provides very powerful control capabilities. If you are using AutoMQ, you can also use products like Kafdrop and Redpanda Console to manage AutoMQ clusters.
Today, we are sharing how to monitor the status of an AutoMQ cluster using Redpanda Console to enhance system maintainability and stability.
The Redpanda Console is a Kafka Web UI provided by Redpanda for monitoring and managing Redpanda or Kafka clusters. It offers an intuitive user interface where users can easily view cluster status, monitor performance metrics, and manage topics and partitions. This console is designed to simplify the daily operations of data stream systems, enabling users to more effectively maintain and monitor their clusters.
Thanks to AutoMQ's full compatibility with Kafka, it can seamlessly integrate with the Redpanda Console. By leveraging the Redpanda Console, AutoMQ users can also enjoy an intuitive user interface and real-time monitoring of AutoMQ cluster status, including topics, partitions, consumer groups, and their offsets. This monitoring capability not only enhances the efficiency of issue diagnosis but also helps optimize cluster performance and resource utilization.
This tutorial will teach you how to start the Redpanda Console service and use it in conjunction with AutoMQ clusters to achieve cluster status monitoring and management.
-
Deploy the AutoMQ Cluster
-
Prepare the Redpanda Console Environment
Please refer to the official AutoMQ documentation: Cluster Deployment | AutoMQ [3].
There are two ways to deploy the Redpanda Console: via Docker or through the release version. The Docker deployment is simpler, and if you want a quick and easy integration experience with AutoMQ and Redpanda Console, it is recommended to use Docker. If you have specific requirements such as login authentication, SASL authentication, TLS configuration, and log level settings, you can opt for the release version deployment. Below, I will introduce both configuration methods.
Redpanda Console can be deployed via Docker, as referenced in Quick Start [4]. During this process, after setting up the AutoMQ cluster, we already know the addresses and ports of all the Broker nodes. Therefore, we can establish an association between Redpanda Console and the AutoMQ cluster by specifying the `KAFKA_BROKERS` parameter in the Docker startup command. The Docker startup container command is as follows:
docker run -p 8080:8080 -e KAFKA_BROKERS=192.168.0.4:9092,192.168.0.5:9092,192.168.0.6:9092 docker.redpanda.com/redpandadata/console:latest
-
-p 8080:8080: Specifies the port mapping for Redpanda Console service access.
-
KAFKA_BROKERS: Needs to be set to the Broker addresses of your own AutoMQ cluster.
You need to go to the Github Releases page of Redpanda Console: Release Redpanda Console [5], choose the appropriate version, download it, and extract it to a designated folder, such as /opt. The operation commands are as follows:
# ubuntu Linux
cd /opt
sudo curl -L -o redpanda_console.tar.gz https://github.com/redpanda-data/console/releases/download/v2.6.0/redpanda_console_2.6.0_linux_amd64.tar.gz
# unzip, get redpanda_console
sudo tar -xzf redpanda_console.tar.gz
# config set
sudo mkdir -p /etc/redpanda
# write config
sudo vim /etc/redpanda/redpanda-console-config.yaml
An example content of the `redpanda-console-config.yaml` configuration file is as follows:
kafka:
  #Brokers is a list of bootstrap servers with
  #port (for example "localhost:9092").
  brokers:
    - broker-0.mycompany.com:19092
    - broker-1.mycompany.com:19092
    - broker-2.mycompany.com:19092
Note: Please ensure that the server where you are currently installing Redpanda Console can access the servers where the Broker nodes are located as specified in the configuration file.
For more detailed configuration settings, please refer to the official documentation: Redpanda Console Configuration [6]. After completing the configuration, you need to set the environment variables so that the Redpanda Console executable file can retrieve the configuration file information and start the Redpanda Console:
# set env
export CONFIG_FILEPATH="/etc/redpanda/redpanda-console-config.yaml"
# /opt/ run console
./redpanda-console
You will get the following result:
./redpanda-console
{"level":"info","ts":"2024-07-10T09:52:52.958+0800","msg":"started Redpanda Console","version":"2.6.0","built_at":"1717083695"}
{"level":"info","ts":"2024-07-10T09:52:52.963+0800","msg":"connecting to Kafka seed brokers, trying to fetch cluster metadata"}
{"level":"info","ts":"2024-07-10T09:52:54.780+0800","msg":"successfully connected to kafka cluster","advertised_broker_count":1,"topic_count":2,"controller_id":0,"kafka_version":"at least v3.6"}
{"level":"info","ts":"2024-07-10T09:53:05.620+0800","msg":"Server listening on address","address":"[::]:8080","port":8080}
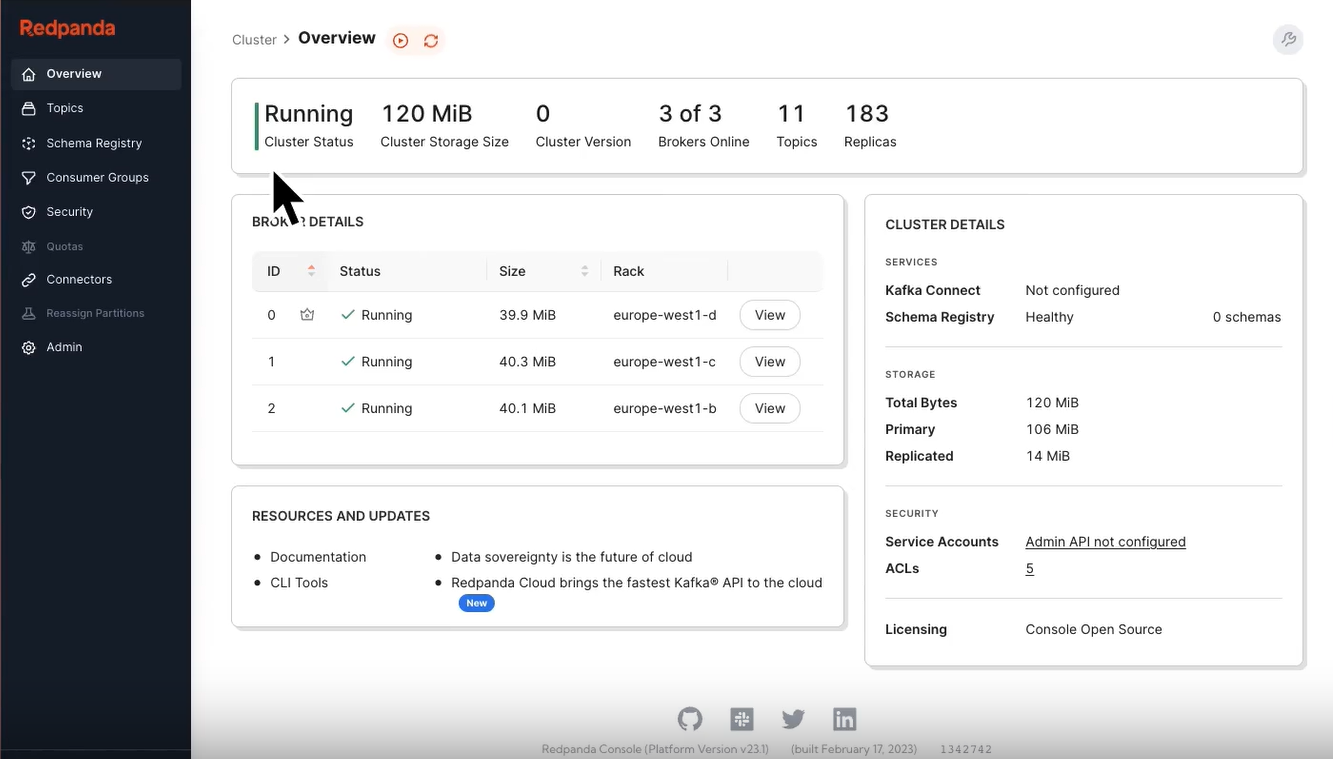
After completing the above deployment steps, you can access the console service by entering the address (e.g., http://{console_ip}:8080) in your browser. The display effect is as follows:
The Cluster Overview page provides users with a macro perspective, showing core information of the AutoMQ cluster. This includes but is not limited to:
-
Cluster Running Status: Shows the current health status of the cluster, enabling users to quickly identify issues.
-
Storage Utilization: Displays data storage usage within the cluster, making it easier for users to manage and plan storage.
-
Version Information: Displays the current version of the AutoMQ cluster, facilitating tracking and upgrades.
-
Number of Online Brokers: Provides a real-time display of the number of online Brokers, a key metric.
-
Number of Topics and Replicas: Offers information on the number of Topics and Replicas, helping users understand the cluster's scale and data replication status.
Monitoring the status of a cluster is crucial for ensuring the stability and performance of a message queue system. By real-time monitoring of the cluster's operating status, storage usage, version information, the number of online Brokers, as well as the number of Topics and Replicas, operations personnel can quickly identify and resolve potential issues, preventing system failures from affecting business operations. Additionally, these metrics assist in capacity planning and resource management, ensuring the system can handle future data growth. Moreover, understanding the cluster's version information helps users to promptly upgrade software, leveraging the latest features and security patches to enhance overall system reliability and efficiency.
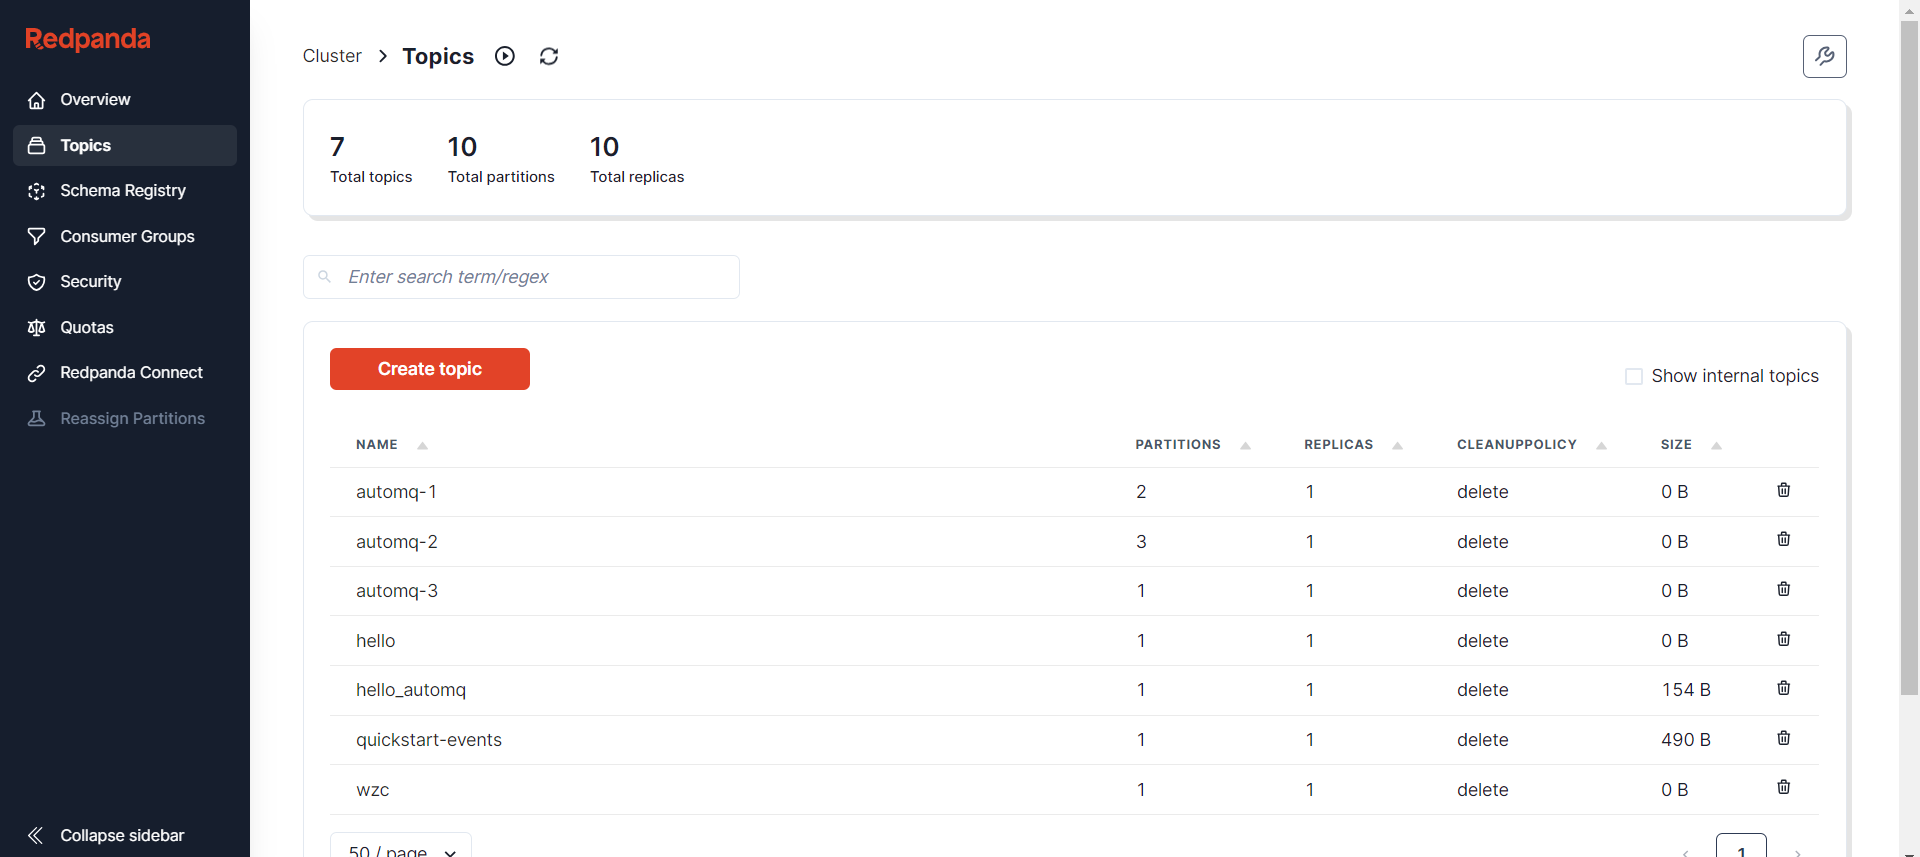
On the Topic list page, users can see a list of all Topics in the current AutoMQ cluster, including key information for each Topic such as the number of partitions and replication strategy. This page allows users to quickly browse and manage Topics.
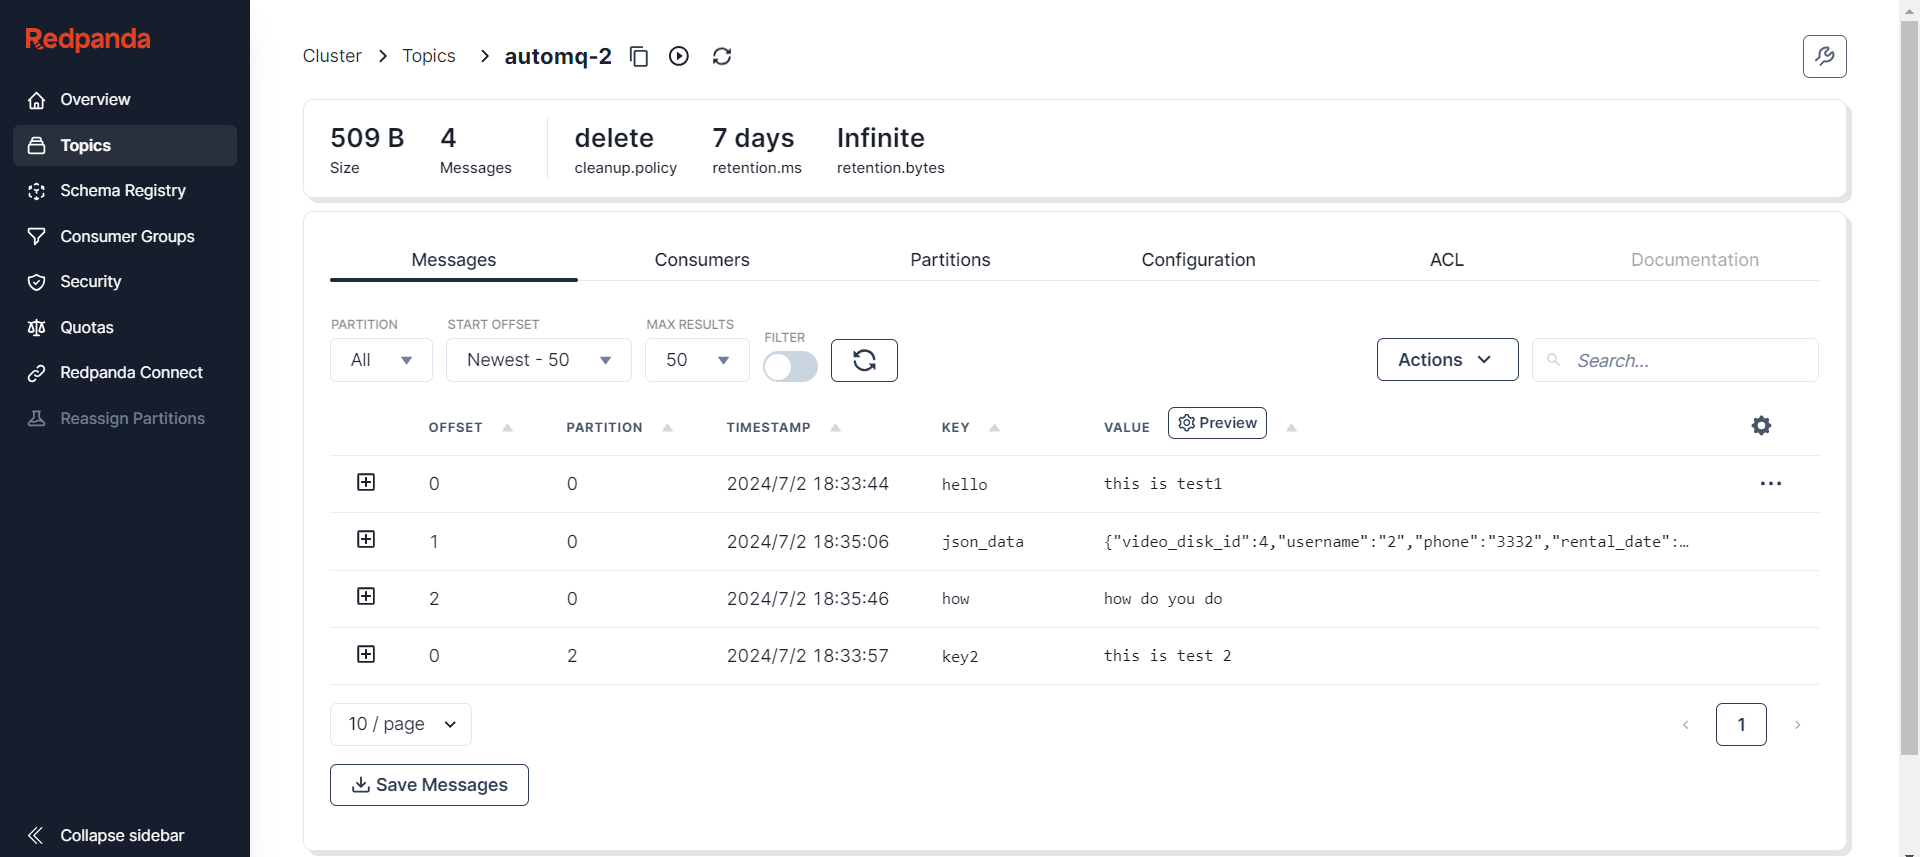
By clicking on a specific Topic, users will enter the detailed page for that Topic, where they can further explore and operate:
-
Message List: Browse and search messages within the Topic, useful for tracking and debugging messages.
-
Consumer Information: Displays information about current consumers and Consumer Groups subscribing to the Topic, facilitating consumption monitoring.
-
Partition Status: Shows detailed information for each partition, including key metrics like Leader and ISR.
-
Configuration Information: Lists the configuration details of a Topic, allowing modifications to optimize performance or behavior.
-
ACL (Access Control List): Manages access permissions to the Topic, ensuring data security.
Additionally, Redpanda Console supports users in manually creating and publishing messages, which is particularly valuable for testing or injecting messages in specific scenarios.
Monitoring Topic details allows us to gain a deep understanding of the message queue's operational status. By browsing the message list, you can trace and debug, monitor consumer information to track consumption, understand partition status to ensure data distribution and high availability, manage configuration information to optimize performance, and set access controls to ensure data security. These features help identify and resolve issues promptly, improving the overall efficiency and reliability of the system.
This article introduces the process of integrating Redpanda Console with AutoMQ, demonstrating how this powerful tool simplifies and enhances the management of AutoMQ clusters. It is hoped that this article will provide practical reference for users seeking to improve the efficiency and functionality of message queue management.
[1] Redpanda Console: https://redpanda.com/redpanda-console-kafka-ui
[2] Redpanda: https://redpanda.com/
[3] Cluster Deployment of AutoMQ: https://docs.automq.com/docs/automq-opensource/IyXrw3lHriVPdQkQLDvcPGQdnNh
[4] Quick Start: https://github.com/redpanda-data/console?tab=readme-ov-file#quick-start
[5] Release Redpanda Console: https://github.com/redpanda-data/console/releases/tag/v2.6.0
[6] Redpanda Console Configuration: https://docs.redpanda.com/current/reference/console/config/#example-redpanda-console-configuration-file
[7] Kafdrop Github: https://github.com/obsidiandynamics/kafdrop
- What is automq: Overview
- Difference with Apache Kafka
- Difference with WarpStream
- Difference with Tiered Storage
- Compatibility with Apache Kafka
- Licensing
- Deploy Locally
- Cluster Deployment on Linux
- Cluster Deployment on Kubernetes
- Example: Produce & Consume Message
- Example: Simple Benchmark
- Example: Partition Reassignment in Seconds
- Example: Self Balancing when Cluster Nodes Change
- Example: Continuous Data Self Balancing
-
S3stream shared streaming storage
-
Technical advantage
- Deployment: Overview
- Runs on Cloud
- Runs on CEPH
- Runs on CubeFS
- Runs on MinIO
- Runs on HDFS
- Configuration
-
Data analysis
-
Object storage
-
Kafka ui
-
Observability
-
Data integration


