Remote Debugging using GDB
The GNU Debugger (GDB) is a command driven debugger client that can be used to debug the cross-compiled application running on the NXT. In a cross-development environment, the NXT is actually running a different instruction set and may be entirely different from the Host. Consequently, the GDB client we use must be a cross-development debugger (in our case, the GDB client should be named arm-none-eabi-gdb). Alternatively, Graphical Front-ends such as the Eclipse CDT Debugger integrates with GDB to control the execution of the application. The main difference between normal GDB debugging and NXT-based GDB debugging is that the application is not running on the same host as the GDB client. This is termed Remote Debugging. Traditionally, remote debugging allows the GDB client to debug an application running on a different computer, connected via a serial connection. There should also be a GDB server process which understands the debugging commands sent by the GDB client via the serial connection, and control the application accordingly, to start, stop, examine variables and step through the instructions. For many current embedded devices such as the NXT, serial connections are no longer used; this necessitates the use of a GDB server which interposes between the GDB Client and the embedded device, converting the debugging commands from the GDB client to a format which can be sent via the USB connection.
The microcontroller in many embedded systems such as the NXT has hardware debugging support, implemented using a Joint Test Action Group (JTAG) interface. This interface is a separate hardware debugging interface which is not enabled by default in the NXT. A JTAG Header (hardware connection interface) would need to be soldered to the circuit board of the NXT in order to enable JTAG Debugging. Furthermore, JTAG Debugging requires the use of a JTAG Emulator or Adapter which can be expensive. Since the focus of this book is on learning software development, the JTAG based approach is not desirable.
A software based solution for GDB Remote Debugging requires a GDB stub module to be running on the embedded system. This GDB stub module interprets the GDB commands sent from the GDB client and performs the appropriate actions. The disadvantage of using a software based solution is that some types of routines, such as Interrupt Service Routines, cannot be debugged reliably, since it would interfere with the driver providing the remote connection support. The greatest advantage is that there is no need for additional hardware components such as the JTAG Adapter; the GDB debugging session is done entirely via USB. Nonetheless, since the GDB Client does not understand how to access USB devices, we must go through a GDB server which accepts the debugging commands and then send it to the NXT via the USB link. A GDB stub module must also be running in the NXT which can understand the GDB commands forwarded by the GDB server, and perform the necessary Debugging actions. Consequently, the Debugging Setup for the NXT looks like the setup as follows:

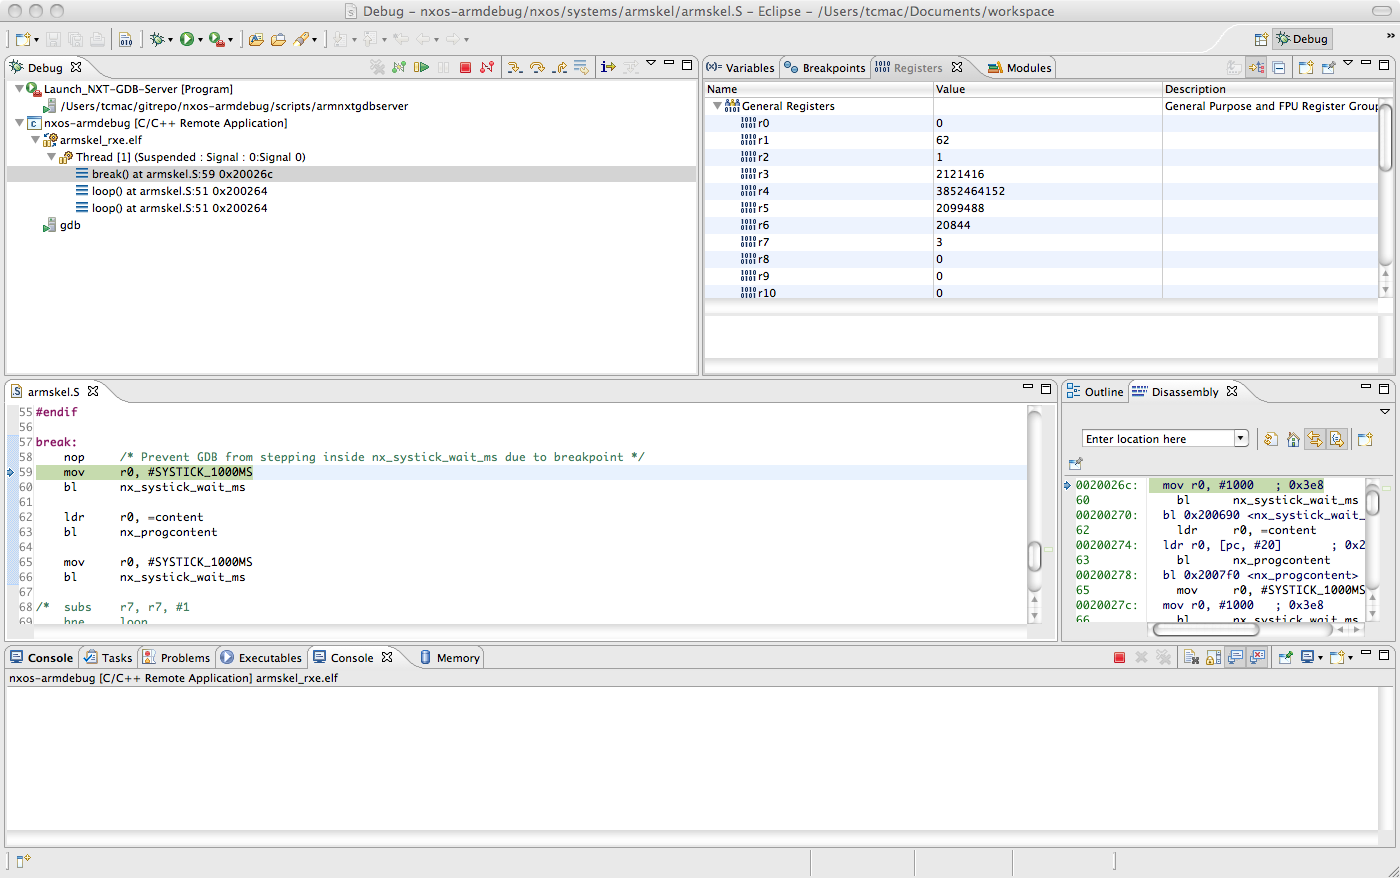
The Debug Environment Layout is configured by selecting the Debug Perspective from the top Toolbar. This brings up the Debug Control Window, Variable and Register Display Window, as well as Source and Disassembly Windows.
After enabling the Debug Perspective, the next step is to connect the USB cable to the NXT, download the NxOS application using NeXT Tool, and run the NxOS Application on the NXT via NeXT Tool or the NXT LCD Menu. Thex NeXT Tool must be exited before the Debugging process begins since the Debugger needs access to the USB connection.
The External Tool Launcher is then activated to invoke the External Debugger Launcher, which runs the GDB Server process to connect to the NxOS application on the NXT. Finally, the Remote Debugging Launcher is configured for the correct application, and launched to start the actual Debugging session.
Buttons to Continue Execution, Step, and Quit GDB Remote debugging are provided in the Debug Control Window Sub-toolbar. In addition, the Routine Call Hierarchy is also indicated in the Debug Control Window. Variables and Register Values can be examined and modified via the Variable and Register Display Window. Finally, Breakpoints can be Set and Cleared using the Source Window.
The following are commonly used GDB commands when debugging using the command line GDB client:
help <command>: provide some basic information about the given command in GDB
target remote: specify the GDB server process to connect to
list: show the contents of the source file where the current excution is halted
disassemble: show the assembly language instructions by reading contents of memory and interpreting them as instructions
info registers: show the contents of registers for the processor
x: examine contents of memory
backtrace: show routine calling hierarchy (requires programs to follow C-style stack frame structure)
break: set breakpoint
step: execute one instruction from the current instruction address location, and return control to GDB
continue: continue execution from the current instruction address location
detach: disconnect from the remotely debugged application, which continues execution
quit: exit GDB, abort execution of the target application if necessary
Detailed usage and all text-based commands are documented here.