-
Notifications
You must be signed in to change notification settings - Fork 25
CorrelatedInputsExample
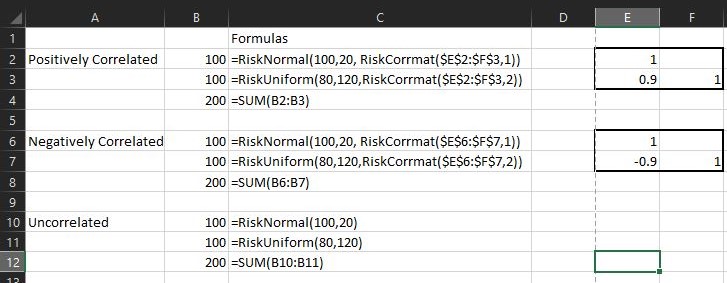
The Correl Example.xlsx demonstrates how you correlate risk inputs using RiskCorrmat function. As you can see in the screenshot below, the model contains three sets of calculations. In all three cases the result is the sum of the same RiskNormal and RiskUniform distributions.

In the first case the two distributions are positively correlated with correlation 0.9. In the second case the two distributions are negatively correlated with correlation -0.9. And in the third case the two distributions are not correlated.
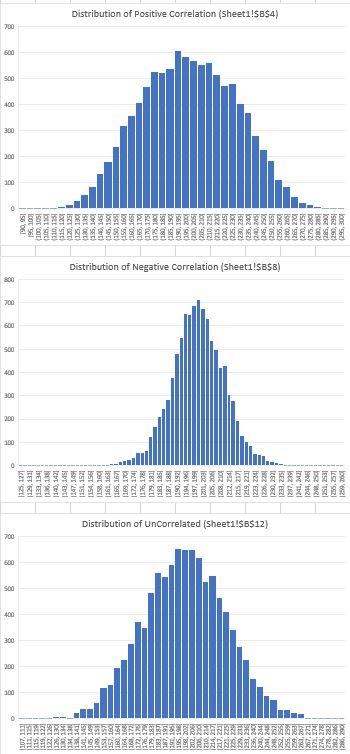
If you add the cells B4, B8 and B12 as outputs and run 10000 iterations you will get results similar to those below:

As you can see the positive correlation increases the standard deviation and variance whilst the negative correlation has the opposite effect. This effect is also shown by viewing the distributions of the output cells below.
