-
Notifications
You must be signed in to change notification settings - Fork 25
WorkedExample
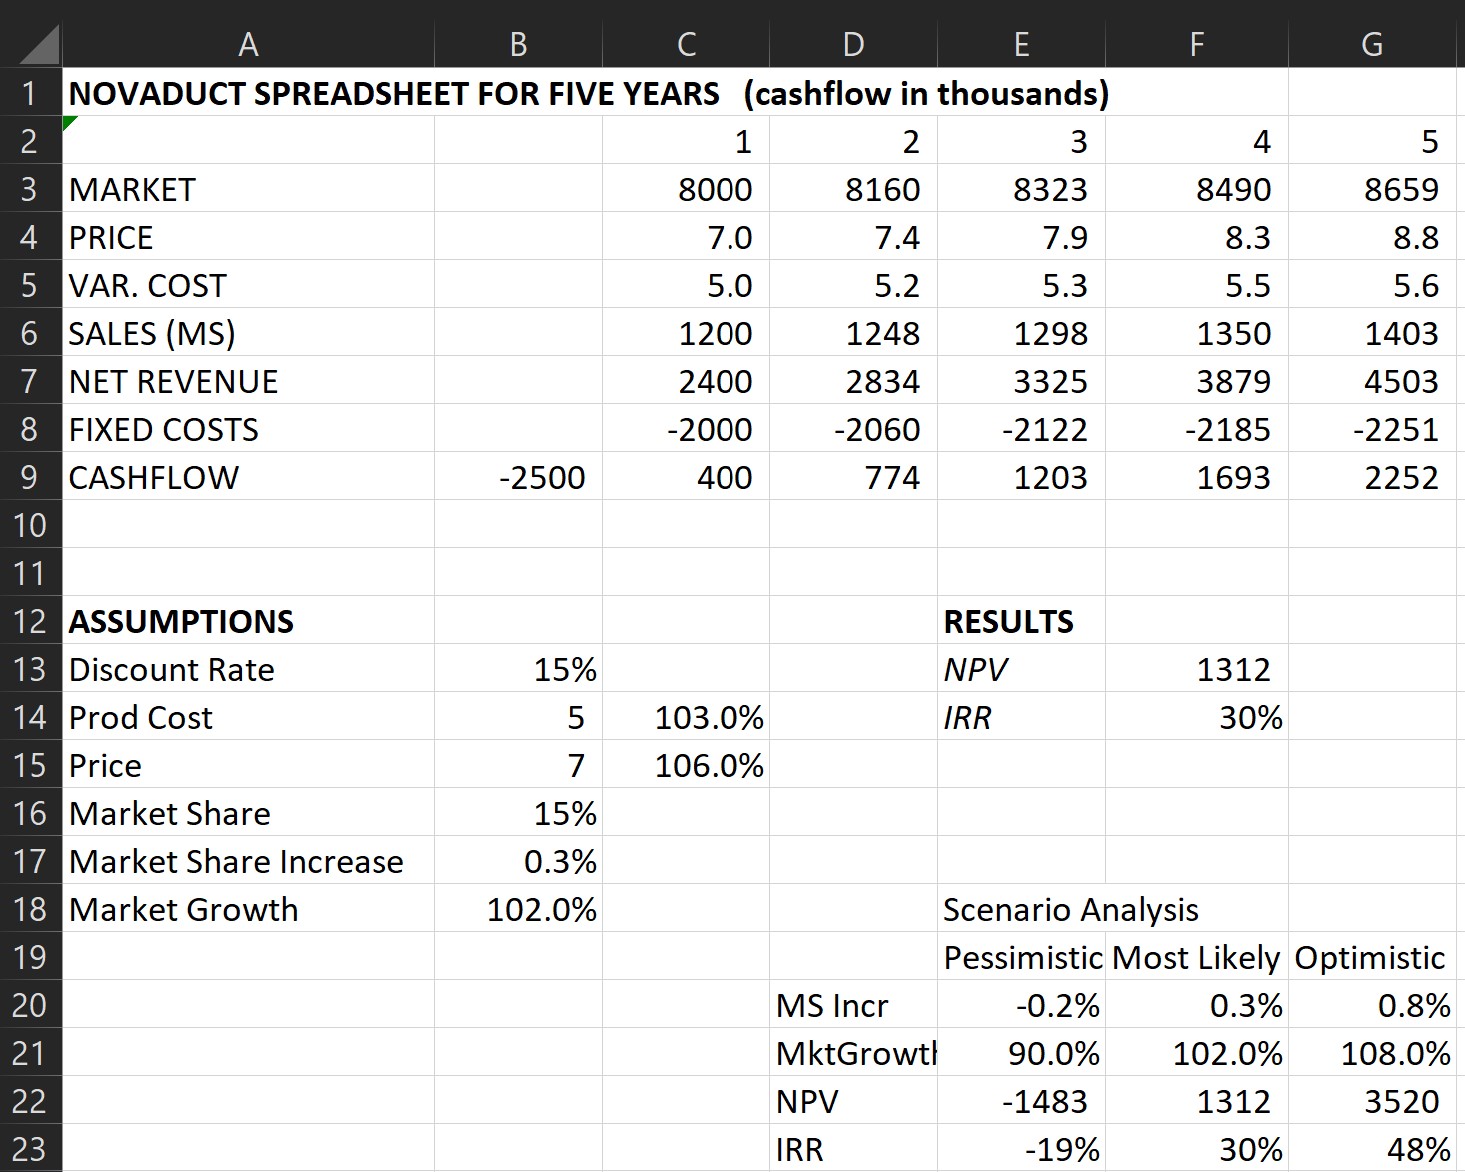
Nova.xlsx contains a cashflow model for a new product shown below. You can download this file if you want to repeat the steps of this worked example.

The model calculates the NPV and IRR of this new product development based on certain assumptions.
Coming-up with probability distributions to specify the uncertainty of model parameters, is the most difficult step in performing Monte-Carlo simulation. This is just an example, so we will keep things simple. We will use the RiskUniform distribution function to describe the uncertainty about "Market Share Increase" and the RiskTriang function to describe the uncertainty about Market Growth.
In cell B17 enter the formula:
=RiskUniform(-0.2%,0.8%)
and in cell B18 the formula:
=RiskTriang(0.9,1.02,1.08)
Initially the cells with the distribution formulas show the mean of their distributions. Press the "Show Samples" buttton in the XLRisk Ribbon tab to show samples of the distributions instead. Then a press F9 (Calculate) a few times and observe the values in the distribution cells as well as the model results changing. This helps you visualize what happens during the simulation.
The number of iterations in a Monte-Carlo simulation is a trade-off between accuracy of the results and execution time. However XLRisk is quite fast and you can run a large number of iterations rather quickly. For this example type into the Iterations combo box of the XLRisk Ribbon tab "5000" and press Enter. If the XLRisk sheet did not exist, it will be created for you at this stage to store the simulation options including the number of Iterations.
Specify the simulation outputs by selecting the cells containing the model results and pressing the "Add Output" button of the XLRisk Ribbon tab. In this model select cell F13 and press the "Add Output" Ribbon button. When asked for a name, type "NPV". Do the same for F14, this time naming the cell "IRR".
Press the Run button in the XLRisk Ribbon tab to run the simulation. While simulation is running, you can observe the progress in the Status Bar. You can also interrupt and terminate the simulation by pressing the stop button on the XLRisk Ribbon tab. After the simulation is completed, a new "Risk Results 1" sheet will be created that contains the results of the simulation.
The simulation results are discussed separately.