-
Notifications
You must be signed in to change notification settings - Fork 339
Handling Alignment Grouping
In a lot of grouping tasks in daily analytic work, the result set is required to be aligned to a specified base set. The more generalized alignment grouping is enumeration grouping. This article illustrates how to handle alignment grouping conveniently and efficiently and provides sample program in esProc. Looking ${article} for details.
An alignment grouping operation compares values of a field or an expression of members of the to-be-grouped set with members of a specified base set, and puts members matching a same member in the base set to same group. The result set will have same number of groups as the number of members in the base set. The alignment grouping operation may produce empty group(s) or leave one or more unmatching members.
Group records in a table by the order of a certain field and perform summarization by each group.
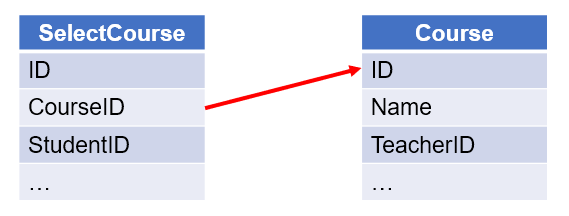
【 Example 1 】 Based on the associated SelectCourse table and Course table, find the unselected courses according to the order in Course table.
【 SPL script 】
| A | B | |
|---|---|---|
| 1 | =connect("db") | /Connect to database |
| 2 | =A1.query("select * from SelectCourse") | / Query SelectCourse table |
| 3 | =A1.query("select * from Course") | /Query Course table |
| 4 | =A2.align(A3:ID,CourseID) | / A.align() function groups records of SelectCourse table by aligning them to ID field of Course table, and get one matching member for each group |
| 5 | =A3(A4.pos@a(null)) | / Get records of unselected courses from Course table (whose corresponding values in the grouping result set are null) |
A5 ’s result:
| ID | NAME | TeacherID |
|---|---|---|
| 1 | Environmental protection and sustainable development | 5 |
| 10 | Music appreciation | 18 |
Group records in a table by the order of a certain field and perform aggregate on each group.
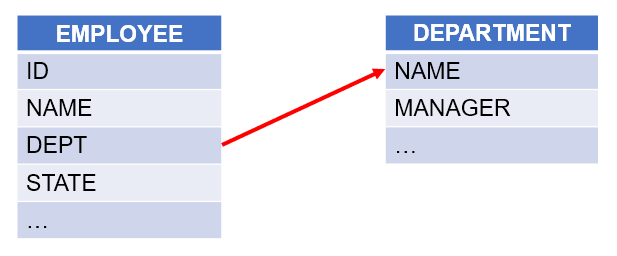
【 Example 2 】 Based on the associated EMPLOYEE table and DEPARTMENT table, calculate the number of employees in each department according to the order in DEPARTMENT table.
【 SPL script 】
| A | B | |
|---|---|---|
| 1 | =connect("db") | / Connect to database |
| 2 | =A1.query("select * from EMPLOYEE") | / Query EMPLOYEE table |
| 3 | =A1.query("select * from DEPARTMENT") | / Query DEPARTMENT table |
| 4 | =A2.align@a(A3:ID, DEPARTMENT) | / A.align@a() function groups records of EMPLOYEE table by aligning them to ID field of DEPARTMENT table, and get all matching members for each group; @a option enables returning all matching members for each group |
| 5 | =A4.new(DEPT, ~.count():COUNT) | / Count employees in each department |
A5 ’s result:
| DEPT | COUNT |
|---|---|
| Admin | 4 |
| R&D | 29 |
| Sales | 187 |
| … | … |
Group records in a table by the order of a certain field and put unmatching records into a new group.
【 Example 3 】 Based on the SALARY table (Below is a part of it), calculate the average salary for the states of [California, Texas, New York, Florida] and for other states as a whole, which are classified as “Other”.
| ID | NAME | STATE | SALARY |
|---|---|---|---|
| 1 | Rebecca | California | 7000 |
| 2 | Ashley | New York | 11000 |
| 3 | Rachel | New Mexico | 9000 |
| 4 | Emily | Texas | 7000 |
| 5 | Ashley | Texas | 16000 |
| … | … | … | … |
【 SPL script 】
| A | B | |
|---|---|---|
| 1 | =connect("db") | / Connect to database |
| 2 | =A1.query("select * from SALARY") | / Query SALARY table |
| 3 | [California,Texas,New York,Florida] | / Define a sequence of states |
| 4 | =A2.align@an(A3,STATE) | / align@an function groups records of SALARY table by the specified states; @a option enables returning all matching records for each group, and @n option creates a new group to hold the unmatching records |
| 5 | =A4.new(if (#>A3.len(),"Other",STATE):STATE,~.avg(SALARY):AvgSalary) | / Calculate the average salary in each group and generate a new table sequence; change the last group name to “Other”, otherwise it is the state in the first record of the current group |
A5 ’s result:
| STATE | SALARY |
|---|---|
| California | 7700.0 |
| Texas | 7592.59 |
| New York | 7677.77 |
| Florida | 7145.16 |
| Other | 7308.1 |
The sequence-number-based alignment grouping operation groups members in a set according to specified sequence numbers. It puts members of same sequence numbers in same group.
Find the records that are not referenced based on two associated table.
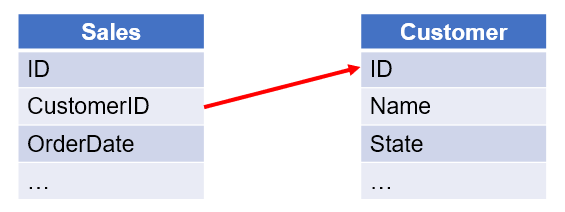
【 Example 4 】 Based on the associated Sales table and Customer table, list customers that have no orders in 2014.
【 SPL script 】
| A | B | |
|---|---|---|
| 1 | =connect("db") | / Connect to database |
| 2 | =A1.query("select * from Sales") | / Query Sales table |
| 3 | =A1.query("select * from Customer") | / Query Customer table |
| 4 | =A3.(ID) | / Get customer IDs from Customer table |
| 5 | =A2.align(A4.len(), A4.pos(CustomerID)) | / A.align(n,y) function groups Sales table by aligning its records to customer IDs |
| 6 | =A3(A5.pos@a(null)) | / Get customer records having no orders from Customer table (where the order values are null) |
A6’s result:
| ID | Name | State | … |
|---|---|---|---|
| ALFKI | CMA-CGM | Texas | … |
| CENTC | Nedlloyd | Florida | … |
Group records in a table by sequence numbers and perform aggregate on each group.
【 Example 5 】 Based on the following orders table (only a part of the data is shown), list the number of orders in each month of the year 2013.
| ID | CustomerID | OrderDate | Amount |
|---|---|---|---|
| 10248 | VINET | 2012/07/04 | 428.0 |
| 10249 | TOMSP | 2012/07/05 | 1842.0 |
| 10250 | HANAR | 2012/07/08 | 1523.5 |
| 10251 | VICTE | 2012/07/08 | 624.95 |
| 10252 | SUPRD | 2012/07/09 | 3559.5 |
| … | … | … | … |
【 SPL script 】
| A | B | |
|---|---|---|
| 1 | =connect("db") | / Connect to database |
| 2 | =A1.query("select * from Orders where year(OrderDate)=2013") | / Get orders records of 2013 |
| 3 | =A2.align@a(12,month(OrderDate)) | / A.align@a() function divides the orders records of 2013 into 12 groups according to the 12 months; @a option enables returning all matching records for each group |
| 4 | =A3.new(#:Month,~.count():OrderCount) | / Count orders in each month |
A4 ’s result:
| Month | OrderCount |
|---|---|
| 1 | 33 |
| 2 | 29 |
| 3 | 30 |
| 4 | 31 |
| 5 | 32 |
| 6 | 30 |
| 7 | 33 |
| 8 | 33 |
| 9 | 37 |
| 10 | 38 |
| 11 | 34 |
| 12 | 48 |
Get a sequence of sequence numbers and divide records by aligning records to it. A record could be put into more than one group during the process.
【 Example 6 】 Based on the post records table, group posts by tags and calculate the frequency of each tag. Below is part of the source table:
| ID | Title | Author | Label |
|---|---|---|---|
| 1 | Easy analysis of Excel | 2 | Excel,ETL,Import,Export |
| 2 | Early commute: Easy to pivot excel | 3 | Excel,Pivot,Python |
| 3 | Initial experience of SPL | 1 | Basics,Introduction |
| 4 | Talking about set and reference | 4 | Set,Reference,Dispersed,SQL |
| 5 | Early commute: Better weapon than Python | 4 | Python,Contrast,Install |
| … | … | … | … |
【 SPL script 】
| A | B | |
|---|---|---|
| 1 | =connect("db") | / Connect to database |
| 2 | =A1.query("select * from PostRecord") | / Query PostRecord table |
| 3 | =A2.conj(Label.split(",")).id() | / Split each Label value by comma and concatenate all labels into one sequence and get all unique labels |
| 4 | =A2.align@ar(A3.len(),A3.pos(Label.split(","))) | / align function works with @r option to put each post record into a corresponding group according to the sequence number of each of its label in the label list |
| 5 | =A4.new(A3(#):Label,~.count():Count).sort@z(Count) | / Count the posts under each label and sort the result set in descending order |
A5 ’s result:
| Label | Count |
|---|---|
| SPL | 7 |
| SQL | 6 |
| Basics | 5 |
| … | … |
Divide records in a table into multiple segments according to ranges of values in a specified field, and perform aggregate on each group.
【 Example 7 】 Based on the salary table, group records according to salary ranges <8000, ≤ 8000 & ≥ 12000, >12000, and calculate the number of employees in each group. Below is part of the source table:
| ID | NAME | BIRTHDAY | SALARY |
|---|---|---|---|
| 1 | Rebecca | 1974-11-20 | 7000 |
| 2 | Ashley | 1980-07-19 | 11000 |
| 3 | Rachel | 1970-12-17 | 9000 |
| 4 | Emily | 1985-03-07 | 7000 |
| 5 | Ashley | 1975-05-13 | 16000 |
| … | … | … | … |
【 SPL script 】
| A | B | |
|---|---|---|
| 1 | =connect("db") | / Connect to database |
| 2 | =A1.query("select * from EMPLOYEE") | / Query EMPLOYEE table |
| 3 | [0,8000,12000] | / Define salary ranges |
| 4 | =A2.align@a(A3.len(),A3.pseg(SALARY)) | / A.pseg(x) function gets the range for salary of each record |
| 5 | =A4.new(A3 (#):SALARY,~.count():COUNT) | / Count the employees in each group |
A5 ’s result:
| SALARY | COUNT |
|---|---|
| 0 | 308 |
| 8000 | 153 |
| 12000 | 39 |
The following task requires grouping records by specified ranges according to the expression result, and calculates average.
【 Example 8 】 Based on the employee table, group records by ranges of hire durations, which are <10 years, ≥ 10 years & ≤ 20 years, and ≥ 20 years, and calculate average salary in each group. Below is part of the source table:
| ID | NAME | BIRTHDAY | SALARY |
|---|---|---|---|
| 1 | Rebecca | 1974-11-20 | 7000 |
| 2 | Ashley | 1980-07-19 | 11000 |
| 3 | Rachel | 1970-12-17 | 9000 |
| 4 | Emily | 1985-03-07 | 7000 |
| 5 | Ashley | 1975-05-13 | 16000 |
| … | … | … | … |
【 SPL script 】
| A | B | |
|---|---|---|
| 1 | =connect("db") | / Connect to database |
| 2 | =A1.query("select * from EMPLOYEE") | / Query EMPLOYEE table |
| 3 | [0,10,20] | / Define hire duration ranges |
| 4 | =now() | / Get the current date and time |
| 5 | =A2.align@a(A3.len(),A3.pseg(elapse@y(A4,-~), HIREDATE)) | / A.pseg(x,y) function get the range where the hire date in each record falls |
| 6 | =A5.new(A3(#):EntryYears,~.avg(SALARY):AvgSalary) | / Calculate the average salary |
A6 ’s result:
| EntryYears | AvgSalary |
|---|---|
| 0 | 6777.78 |
| 10 | 7445.53 |
| 20 | 6928.57 |
Enumeration grouping defines a set of enumerated conditions, calculates the conditions using members of the to-be-grouped set as parameters, and puts members making same condition true into one subset. There is a one-to-one relationship between the subsets in the result set and the enumerated conditions.
Group records in a table according to the enumerated conditional expressions and put each record only in the first matching group.
【 Example 9 】 Based on the table recording population information in China’s major cities, group the cities by population. Below is a part of the source table:
| ID | City | Population | Province |
|---|---|---|---|
| 1 | Shanghai | 12286274 | Shanghai |
| 2 | Beijing | 9931140 | Beijing |
| 3 | Chongqing | 7421420 | Chongqing |
| 4 | Guangzhou | 7240465 | Guangdong |
| 5 | Hong Kong | 7010000 | Hong Kong Special Administrative Region |
| … | … | … | … |
【 SPL script 】
| A | B | |
|---|---|---|
| 1 | =connect("db") | / Connect to database |
| 2 | =A1.query("select * from UrbanPopulation") | / Query UrbanPopulation table |
| 3 | [?>2000000,?>1000000,?>500000,?<=500000] | / Define populations ranges: Megacities: >2 million, Super cities: >1 million & <2 million, Large cities: >0.5 million & <1 million, and Other cities |
| 4 | =A2.enum(A3,Population) | / A.enum()function groups records in UrbanPopulation table according to the enumerated conditions defined in A3 |
A4 ’s result:
Group records in a table according to the specified enumerated conditional expressions, and put unmatching records in a new group.
【 Example 10 】 Based on the employee table, group records by age groups: < 35 years and < 45 years (put unmatching ones to a new group), and calculate average salary in each group. Below is part of the source table:
| ID | NAME | BIRTHDAY | SALARY |
|---|---|---|---|
| 1 | Rebecca | 1974-11-20 | 7000 |
| 2 | Ashley | 1980-07-19 | 11000 |
| 3 | Rachel | 1970-12-17 | 9000 |
| 4 | Emily | 1985-03-07 | 7000 |
| 5 | Ashley | 1975-05-13 | 16000 |
| … | … | … | … |
【 SPL script 】
| A | B | |
|---|---|---|
| 1 | =connect("db") | / Connect to database |
| 2 | =A1.query("select * from EMPLOYEE") | / Query EMPLOYEE table |
| 3 | [?<35,?<45] | / Define two age groups: < 35 years and < 45 years |
| 4 | =A2.enum@n(A3, age(BIRTHDAY)) | / A.enum@n() function groups employee records by the enumerated age groups; @n option enables creating a new group for unmatching records |
| 5 | =A4.new(if (#>A3.len(), "Other",A3(#)):AGE,~.avg(SALARY):AvgSalary) | / Set name of the last group as Other and calculate average salary in each group |
A5 ’s result:
| AGE | AvgSalary |
|---|---|
| ?<35 | 7118.18 |
| ?<45 | 7448.16 |
| Other | 7395.06 |
Group records in a table according to enumerated sequences and perform calculations on each group. A record could be put into more than one group during the process.
【 Example 11 】 Based on the GDP table, calculate the GDP per capita for direct-controlled municipalities, first-tier cities and second-tier cities respectively. Below is part of the source table:
| ID | City | GDP | Population |
|---|---|---|---|
| 1 | Shanghai | 32679 | 2418 |
| 2 | Beijing | 30320 | 2171 |
| 3 | Shenzhen | 24691 | 1253 |
| 4 | Guangzhou | 23000 | 1450 |
| 5 | Chongqing | 20363 | 3372 |
| … | … | … | … |
【 SPL script 】
| A | B | |
|---|---|---|
| 1 | =connect("db") | / Connect to database |
| 2 | =A1.query("select * from GDP") | / Query GDP table |
| 3 | [["Beijing","Shanghai","Tianjin","Chongqing"].pos(?)>0, ["Beijing","Shanghai","Guangzhou","Shenzhen"].pos(?)>0, ["Chengdu","Hangzhou","Chongqing","Wuhan","Xi’an","Suzhou", "Tianjin","Nanjing","Changsha","Zhengzhou","Dongguan","Qingdao", "Shenyang","Ningbo","Kunming"].pos(?)>0] |
/ Enumerate direct-controlled cities, first-tier cities and second-tier cities respectively |
| 4 | =A2.enum@r(A3,City) | / A.enum@r() function records in GDP table according to the enumerated sequences of cities; @r option allows putting a record to more than one groups |
| 5 | =A4.new(A3(#):Area,~.sum(GDP)/~.sum(Population)*10000:CapitaGDP) | / Calcualte GDP per capita in each group |
A5 ’s result:
| Area | CapitaGDP |
|---|---|
| ["Beijing","Shanghai","Tianjin","Chongqing"].pos(?)>0 | 107345.03 |
| ["Beijing","Shanghai","Guangzhou","Shenzhen"].pos(?)>0 | 151796.49 |
| ["Chengdu","Hangzhou","Chongqing","Wuhan","Xi’an","Suzhou","Tianjin","Nanjing", "Changsha","Zhengzhou","Dongguan","Qingdao","Shenyang","Ningbo","Kunming"].pos(?)>0 |
106040.57 |
Find more examples in SPL CookBook.
SPL Resource: SPL Official Website | SPL Blog | Download esProc SPL | SPL Source Code


